- Home >
- Stock Photos >
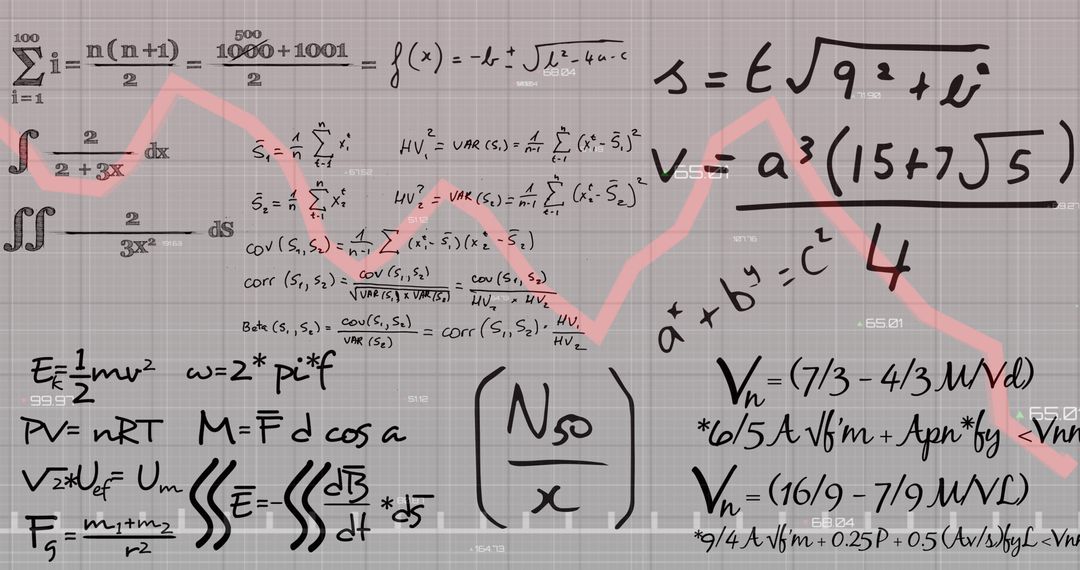
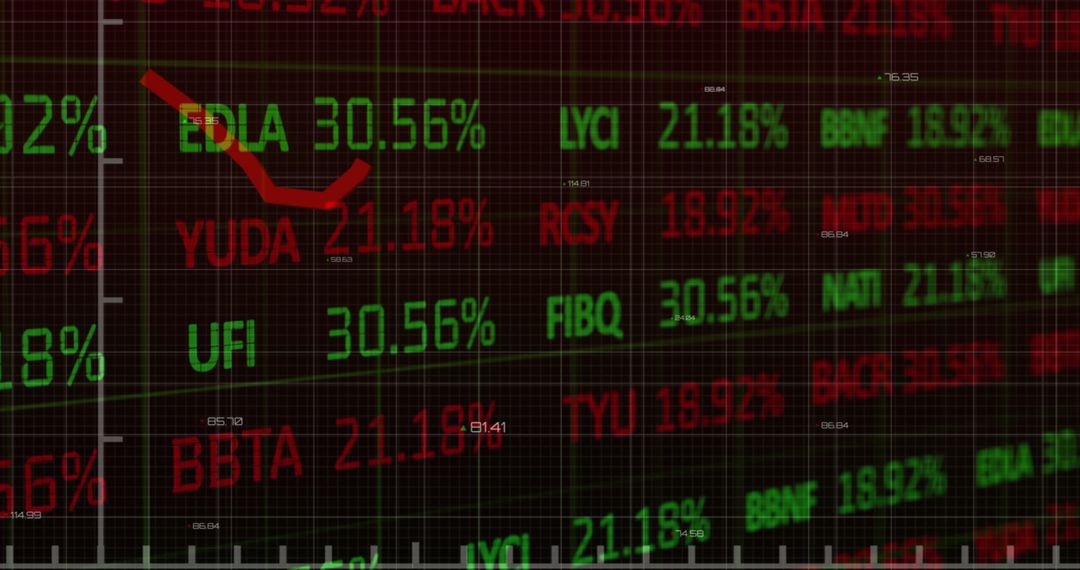
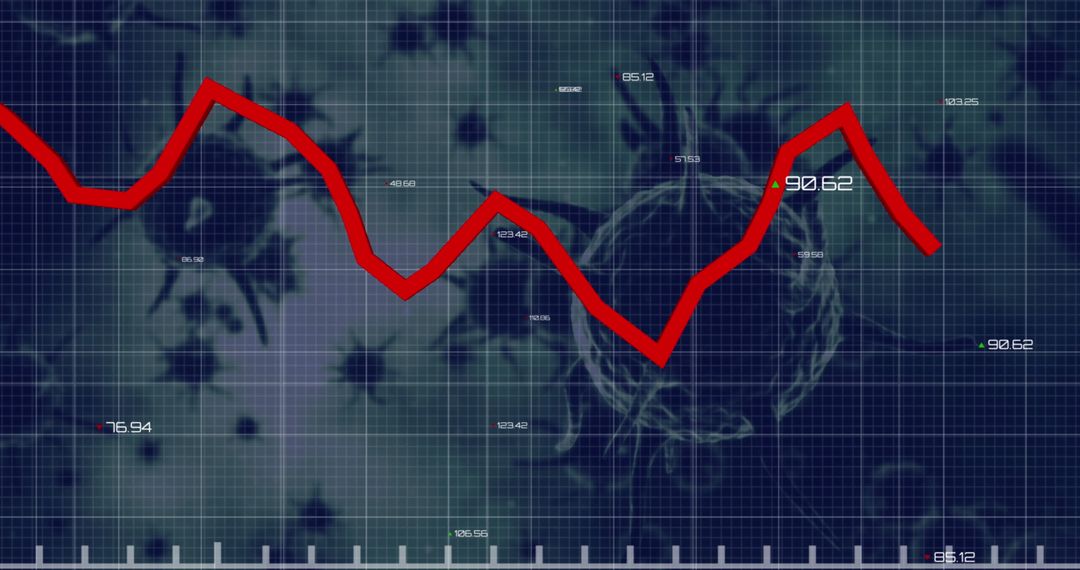
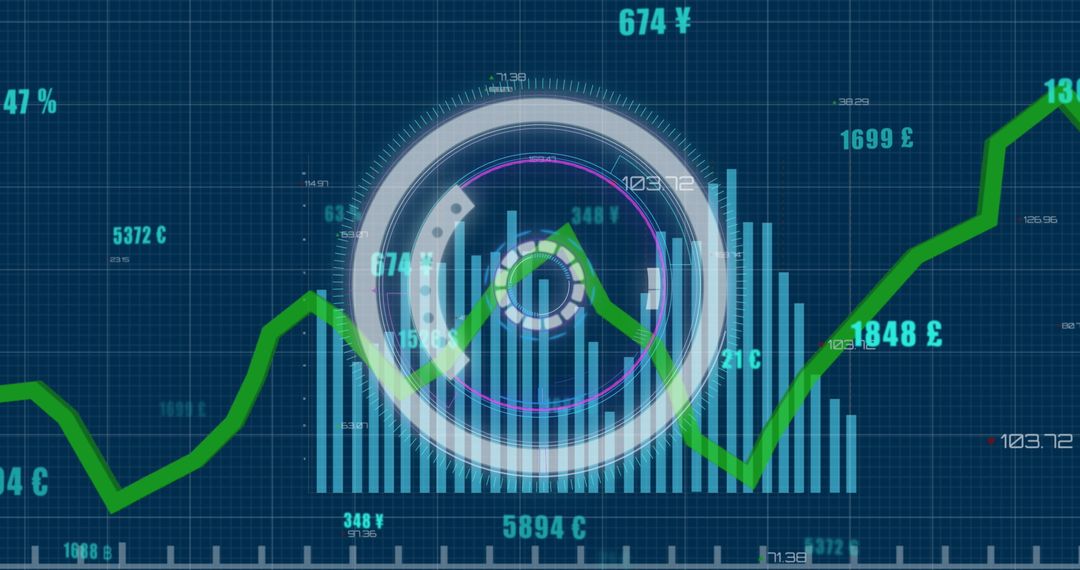
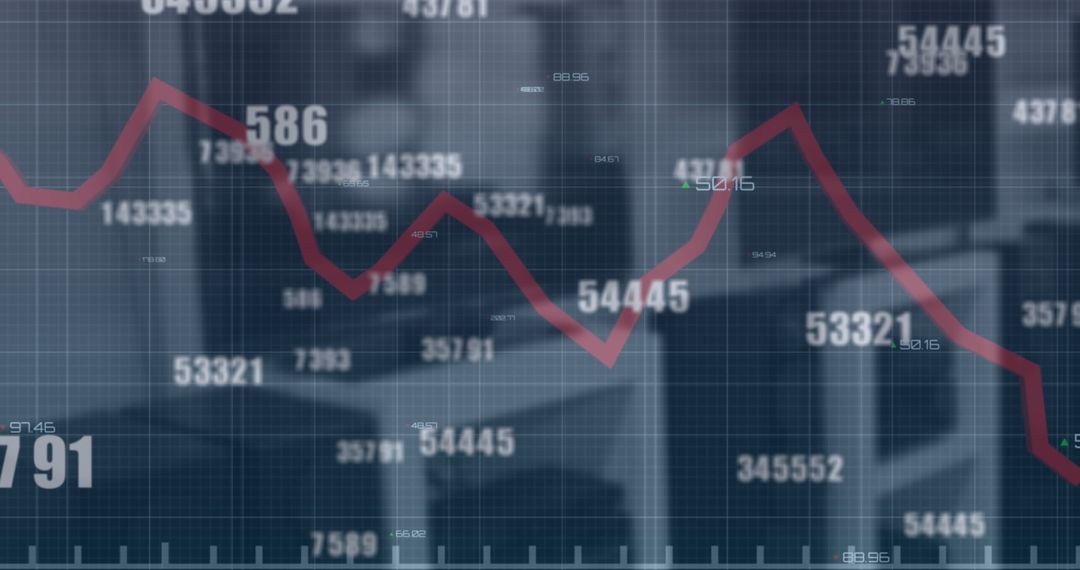
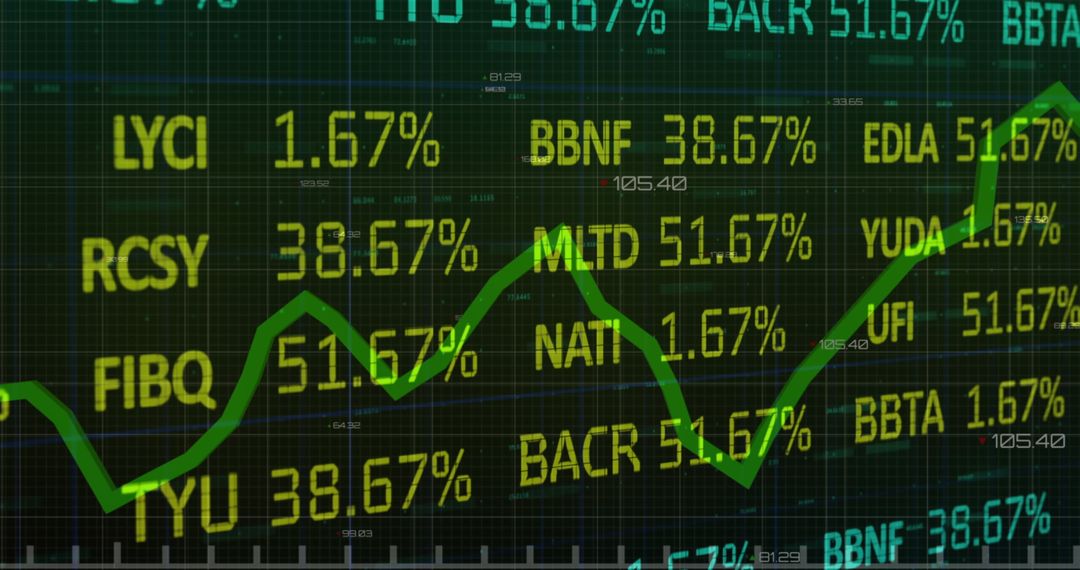
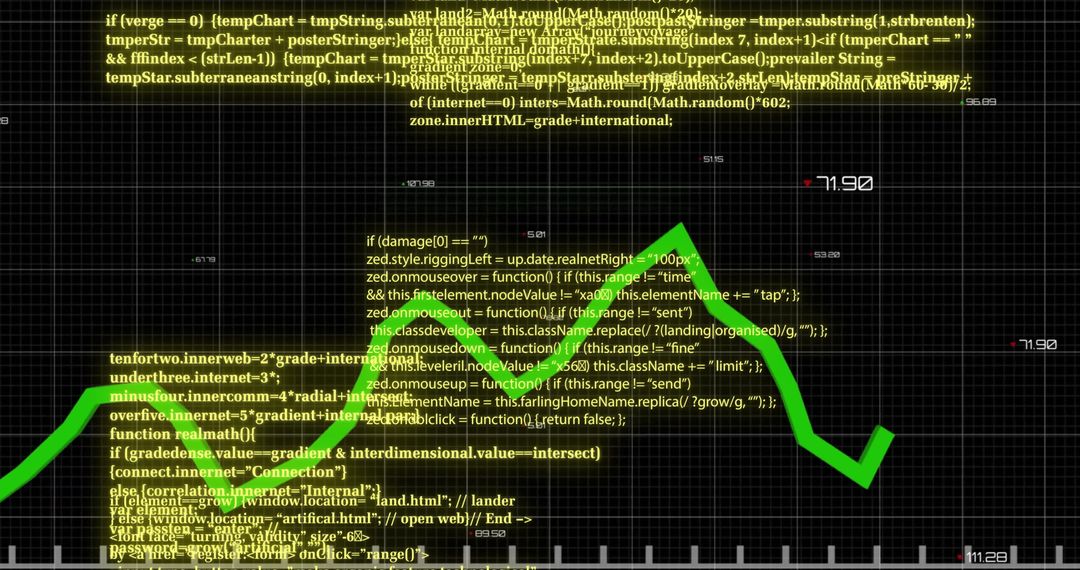
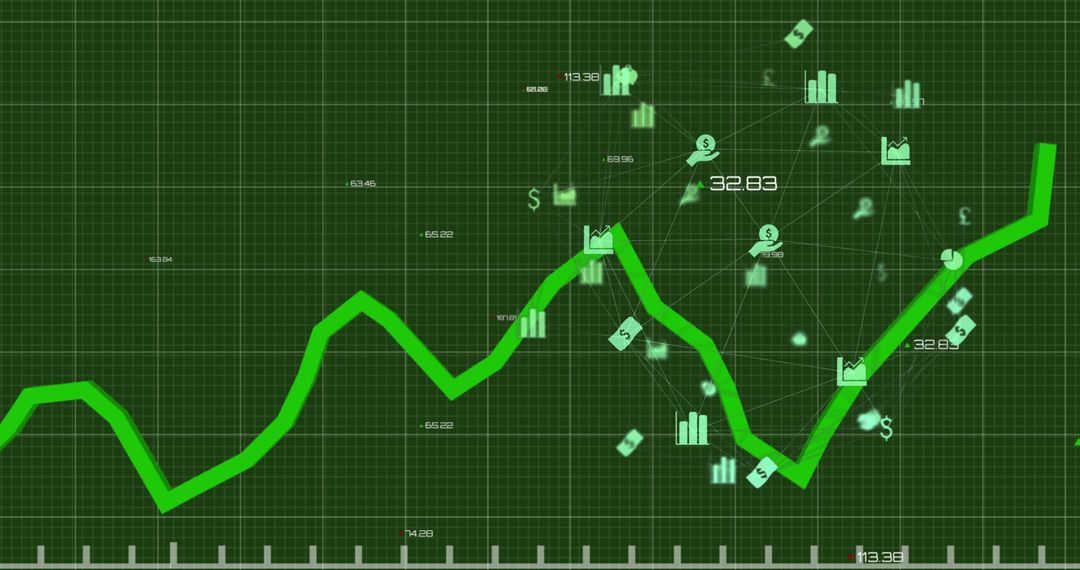
- Stock Market Downturn Displayed in Financial Data 3D Graph
Stock Market Downturn Displayed in Financial Data 3D Graph Image
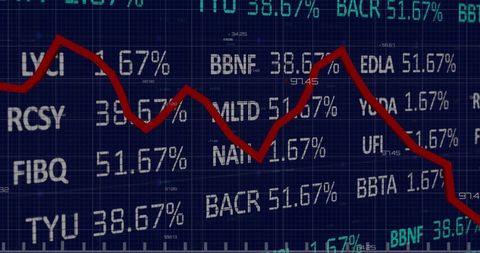
Displaying a digital graph overlaid with numbers and percentages representing stock market fluctuations. Red line indicates downward financial trend, useful for illustrating economic effects, reports on stock markets, or financial analysis presentations.
Powered by 


2
downloads
downloads
Tags:
More
Credit Photo
If you would like to credit the Photo, here are some ways you can do so
Text Link
photo Link
<span class="text-link">
<span>
<a target="_blank" href=https://pikwizard.com/photo/stock-market-downturn-displayed-in-financial-data-3d-graph/adac775ba29eeb4584625dafb4c137f6/>PikWizard</a>
</span>
</span>
<span class="image-link">
<span
style="margin: 0 0 20px 0; display: inline-block; vertical-align: middle; width: 100%;"
>
<a
target="_blank"
href="https://pikwizard.com/photo/stock-market-downturn-displayed-in-financial-data-3d-graph/adac775ba29eeb4584625dafb4c137f6/"
style="text-decoration: none; font-size: 10px; margin: 0;"
>
<img src="https://pikwizard.com/pw/medium/adac775ba29eeb4584625dafb4c137f6.jpg" style="margin: 0; width: 100%;" alt="" />
<p style="font-size: 12px; margin: 0;">PikWizard</p>
</a>
</span>
</span>
Free (free of charge)
Free for personal and commercial use.
Author: Awesome Content
Similar Free Stock Images

Premium


Premium


Premium


Premium


Premium


Premium


Premium


Premium


Premium


Premium


Premium


Premium


Premium


Premium


Premium


Premium


Premium


Premium


Premium


Premium


Premium


Premium


Premium


Premium