- Home >
- Stock Photos >
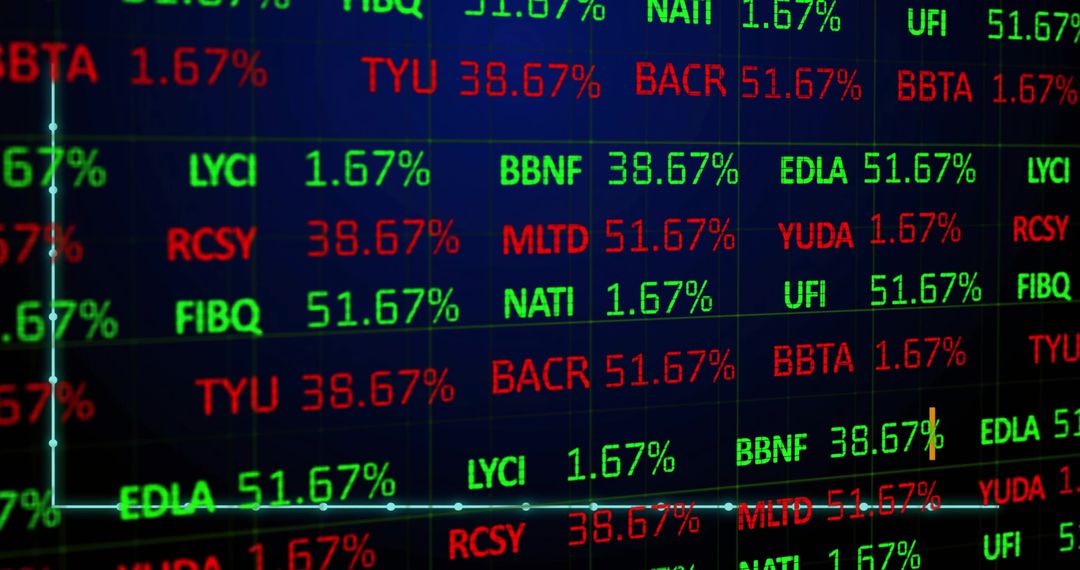
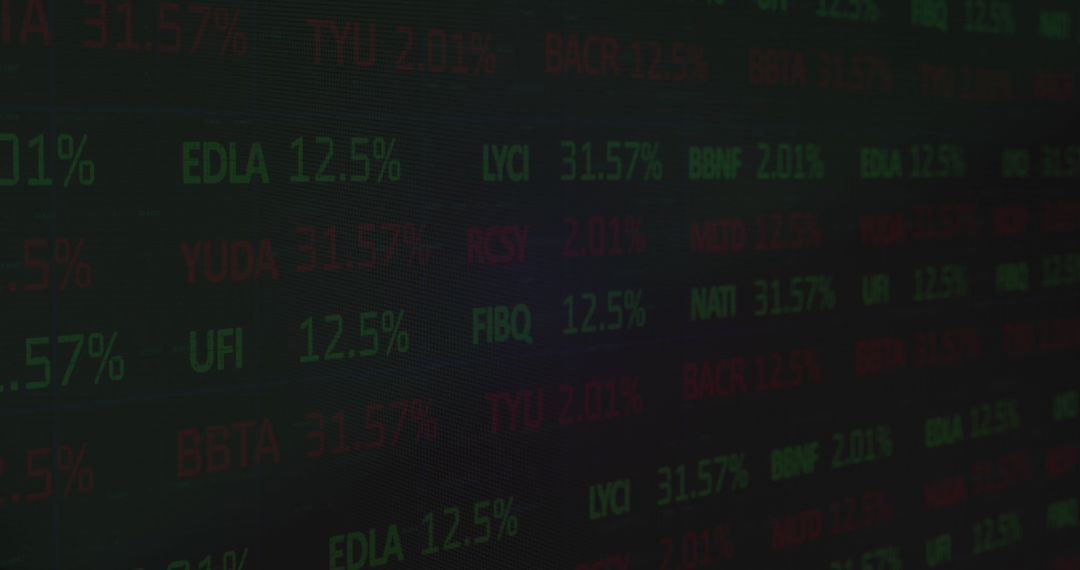
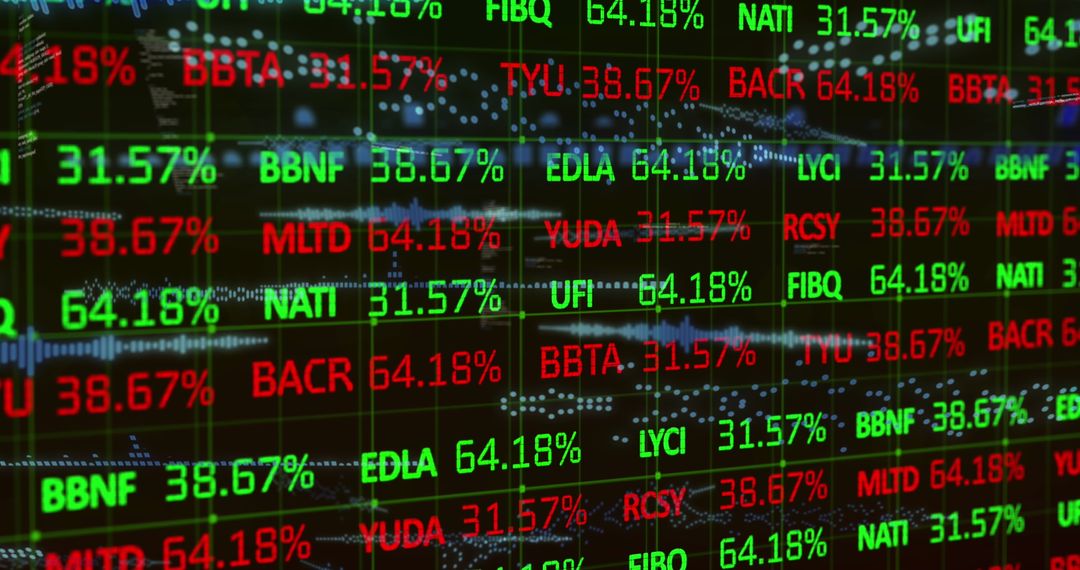
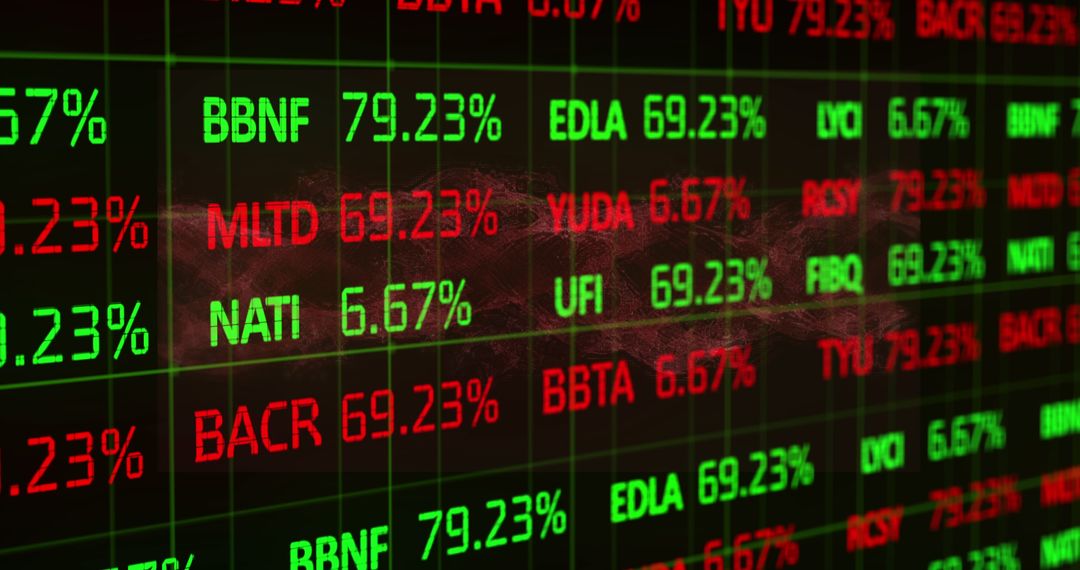
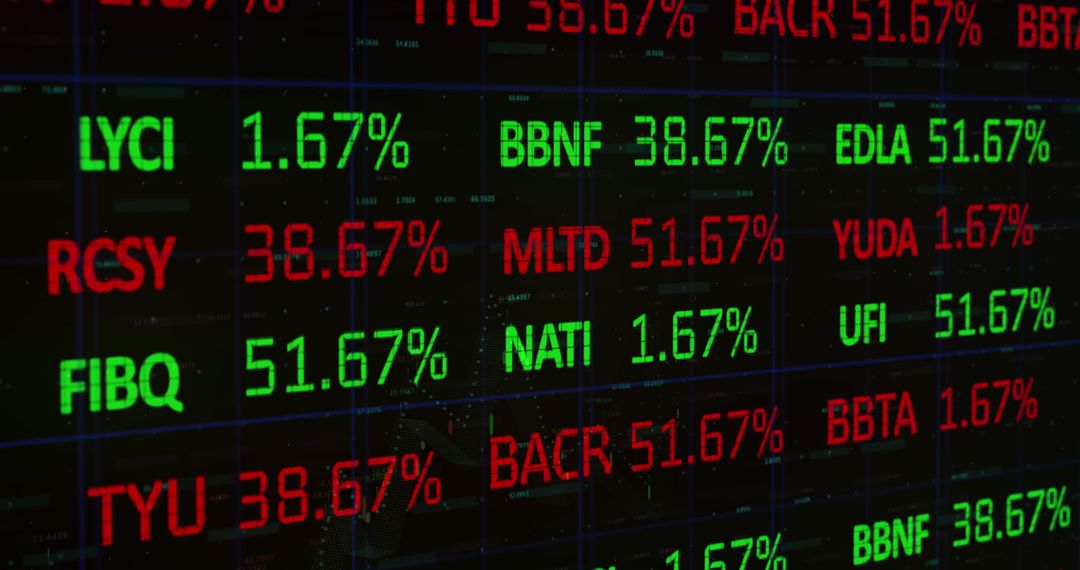
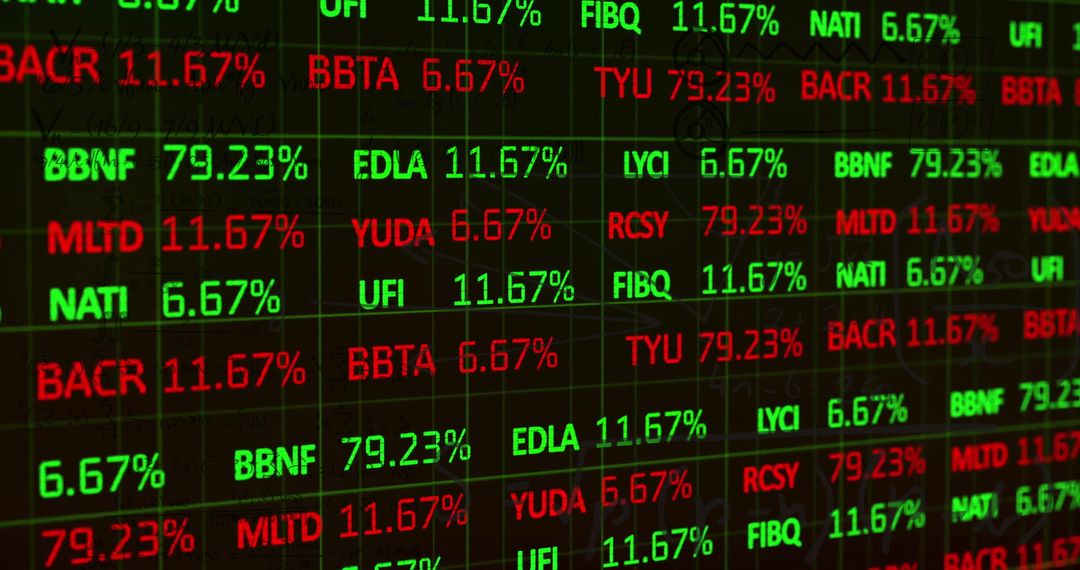
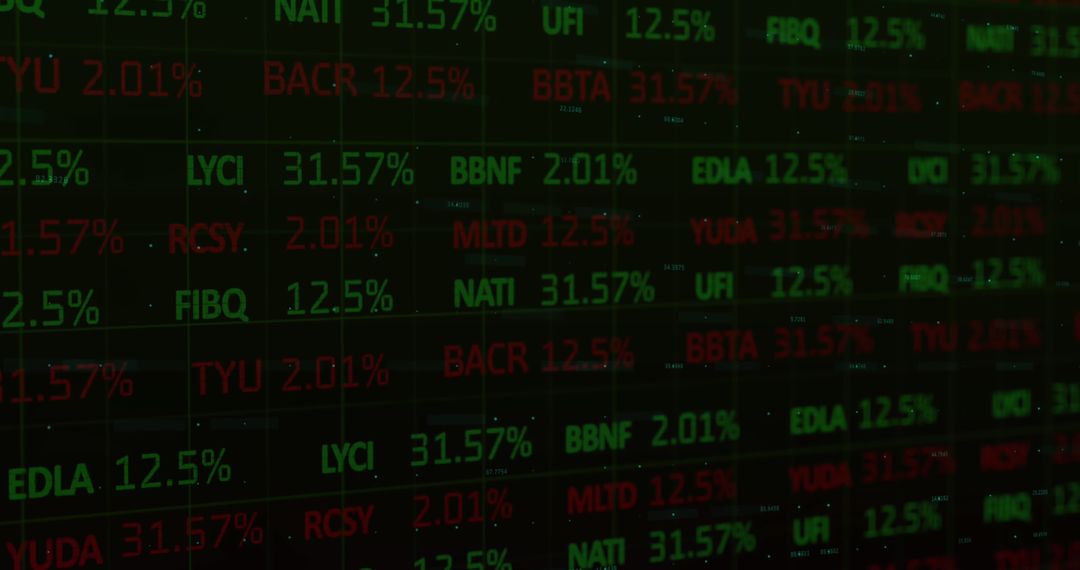
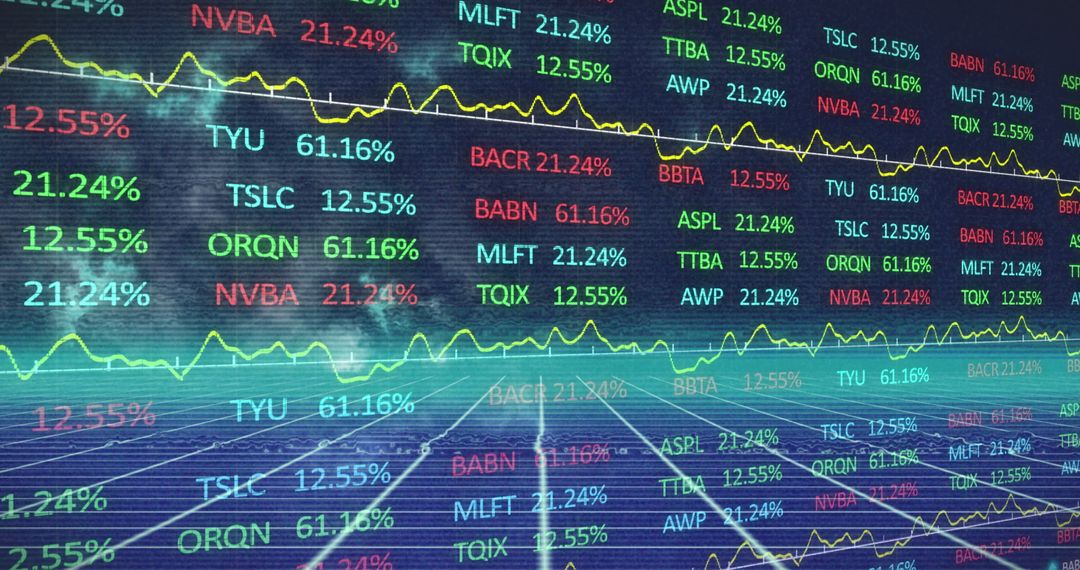
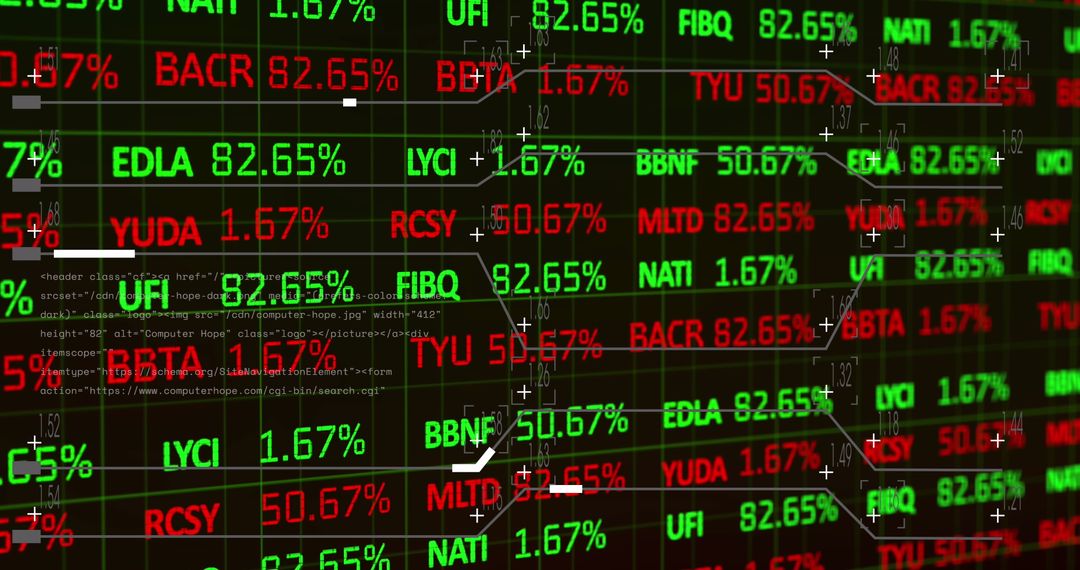
- Stock Market Figures Display on Digital Screen
Stock Market Figures Display on Digital Screen Image

Vibrant representation of stock market graphics and financial data is perfect for illustrating economic news, business analysis, investment reports, or financial websites. Suitable as a background for finance presentations or educational purposes. This imagery conveys modern finance themes and highlights investment activity.
Powered by 


2
downloads
downloads
Tags:
More
Credit Photo
If you would like to credit the Photo, here are some ways you can do so
Text Link
photo Link
<span class="text-link">
<span>
<a target="_blank" href=https://pikwizard.com/photo/stock-market-figures-display-on-digital-screen/bfdc636cb7bd9a0aeadd26097aee52fc/>PikWizard</a>
</span>
</span>
<span class="image-link">
<span
style="margin: 0 0 20px 0; display: inline-block; vertical-align: middle; width: 100%;"
>
<a
target="_blank"
href="https://pikwizard.com/photo/stock-market-figures-display-on-digital-screen/bfdc636cb7bd9a0aeadd26097aee52fc/"
style="text-decoration: none; font-size: 10px; margin: 0;"
>
<img src="https://pikwizard.com/pw/medium/bfdc636cb7bd9a0aeadd26097aee52fc.jpg" style="margin: 0; width: 100%;" alt="" />
<p style="font-size: 12px; margin: 0;">PikWizard</p>
</a>
</span>
</span>
Free (free of charge)
Free for personal and commercial use.
Author: People Creations
Similar Free Stock Images
Premium


Premium


Premium


Premium


Premium


Premium


Premium


Premium


Premium


Premium


Premium


Premium


Premium


Premium


Premium


Premium


Premium


Premium


Premium


Premium


Premium


Premium


Premium


Premium