
- Home >
- Stock Photos >
- Stock Market Trading Screen with Candlesticks and Trend Lines
Stock Market Trading Screen with Candlesticks and Trend Lines Image
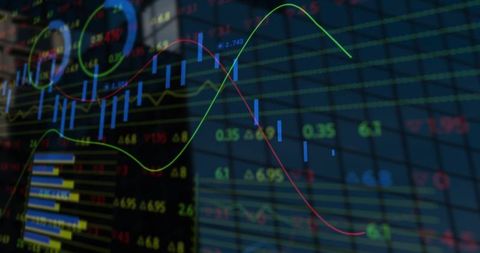
Designed for projects on financial markets, investment insight, or trading strategies. Useful in presentations on economic forecasts, trading platforms, or training in market analysis.
Powered by  - Get 15% off with code: PIKWIZARD15


0
downloads
downloads
Tags:
More
Credit Photo
If you would like to credit the Photo, here are some ways you can do so
Text Link
photo Link
<span class="text-link">
<span>
<a target="_blank" href=https://pikwizard.com/photo/stock-market-trading-screen-with-candlesticks-and-trend-lines/077dfcc5d70d798f9e64635a09d03fcd/>PikWizard</a>
</span>
</span>
<span class="image-link">
<span
style="margin: 0 0 20px 0; display: inline-block; vertical-align: middle; width: 100%;"
>
<a
target="_blank"
href="https://pikwizard.com/photo/stock-market-trading-screen-with-candlesticks-and-trend-lines/077dfcc5d70d798f9e64635a09d03fcd/"
style="text-decoration: none; font-size: 10px; margin: 0;"
>
<img src="https://pikwizard.com/pw/medium/077dfcc5d70d798f9e64635a09d03fcd.jpg" style="margin: 0; width: 100%;" alt="" />
<p style="font-size: 12px; margin: 0;">PikWizard</p>
</a>
</span>
</span>
Free (free of charge)
Free for personal and commercial use.
Author: Awesome Content