
- Home >
- Stock Photos >
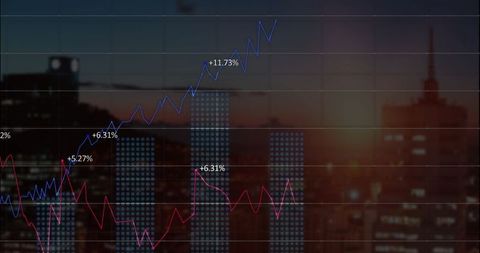
- Stock Market Trends and Data Analysis over Digital Grid
Stock Market Trends and Data Analysis over Digital Grid Image

Ideal for content related to finance, business analytics, economic trends, or technology articles. Useful for illustrating analysis of stock market patterns, highlights on trading systems, or talks about global economic strategy. Perfect for presentations discussing digital finance tools.
Powered by  - Get 15% off with code: PIKWIZARD15


2
downloads
downloads
Tags:
More
Credit Photo
If you would like to credit the Photo, here are some ways you can do so
Text Link
photo Link
<span class="text-link">
<span>
<a target="_blank" href=https://pikwizard.com/photo/stock-market-trends-and-data-analysis-over-digital-grid/e251ad1e3c4d29fe4c4f1fbb9b93e7ce/>PikWizard</a>
</span>
</span>
<span class="image-link">
<span
style="margin: 0 0 20px 0; display: inline-block; vertical-align: middle; width: 100%;"
>
<a
target="_blank"
href="https://pikwizard.com/photo/stock-market-trends-and-data-analysis-over-digital-grid/e251ad1e3c4d29fe4c4f1fbb9b93e7ce/"
style="text-decoration: none; font-size: 10px; margin: 0;"
>
<img src="https://pikwizard.com/pw/medium/e251ad1e3c4d29fe4c4f1fbb9b93e7ce.jpg" style="margin: 0; width: 100%;" alt="" />
<p style="font-size: 12px; margin: 0;">PikWizard</p>
</a>
</span>
</span>
Free (free of charge)
Free for personal and commercial use.
Author: Awesome Content
Similar Free Stock Images

Premium


Premium


Premium


Premium


Premium


Premium


Premium


Premium


Premium


Premium


Premium


Premium


Premium


Premium


Premium


Premium


Premium


Premium


Premium


Premium


Premium


Premium


Premium


Premium


Premium

