- Home >
- Stock Photos >
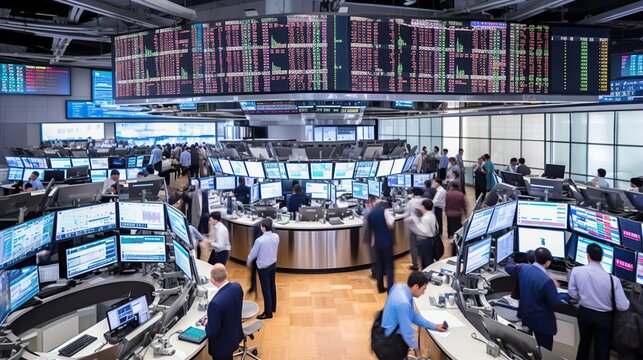
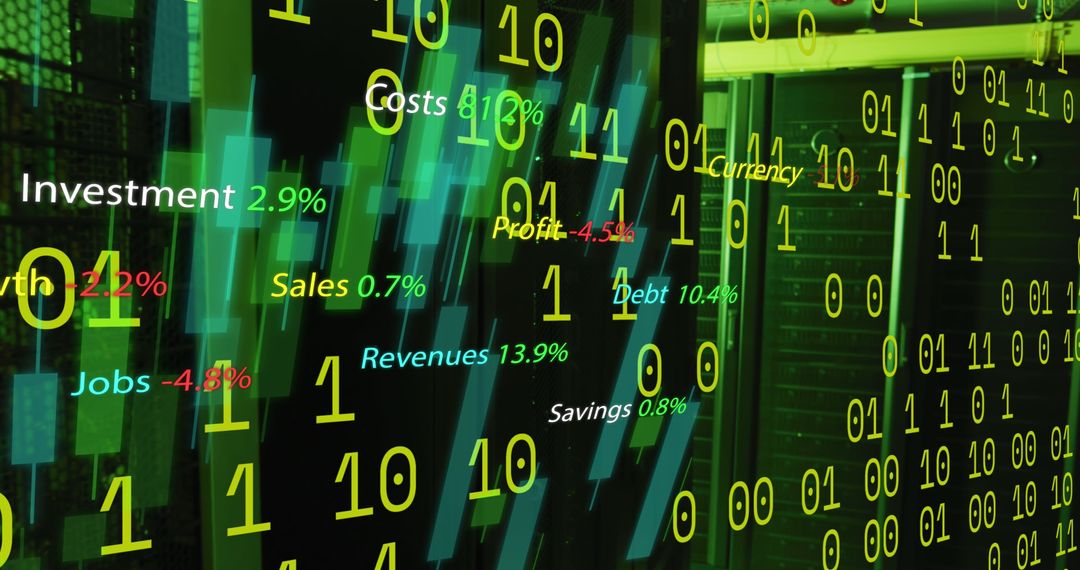
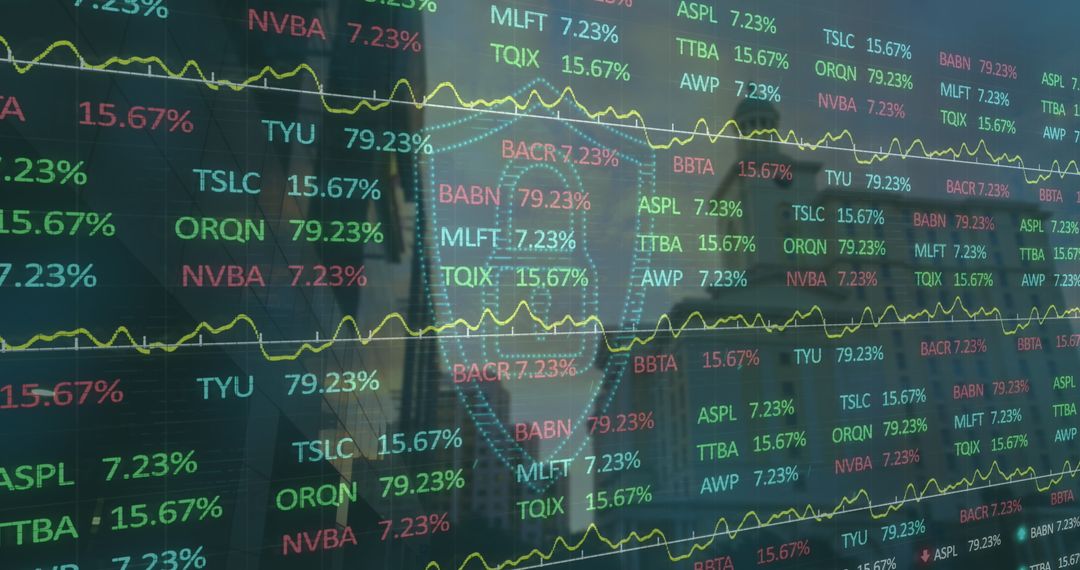
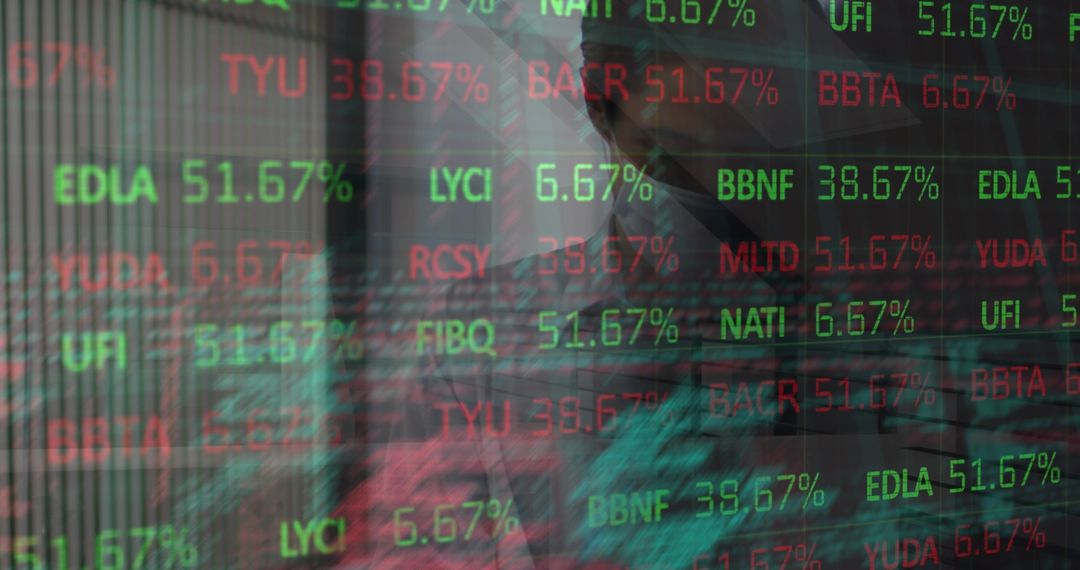
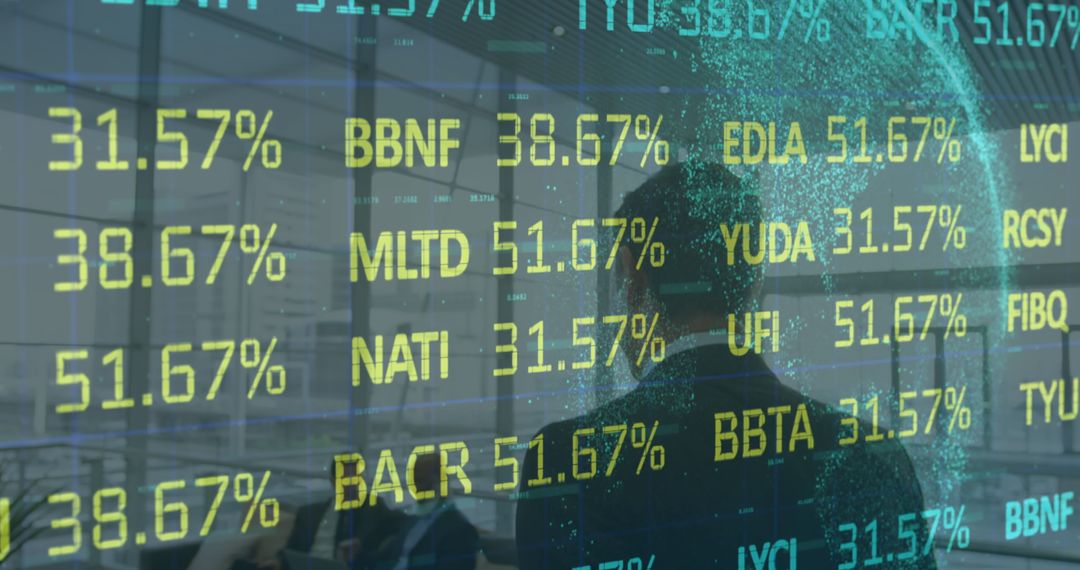
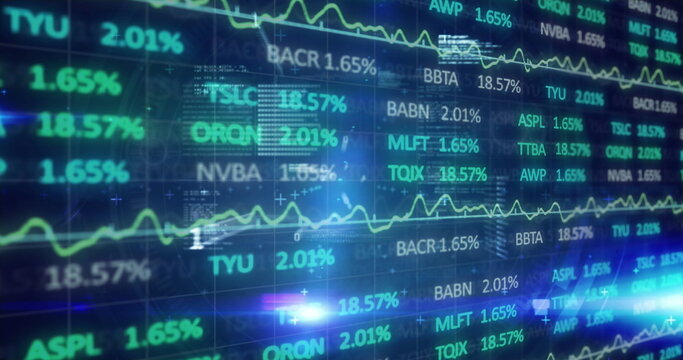
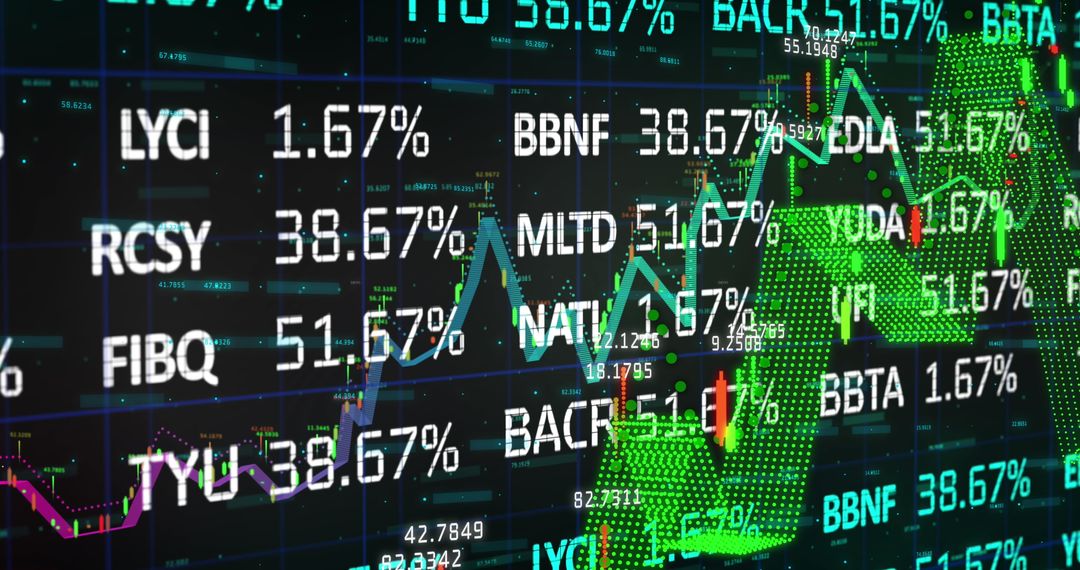
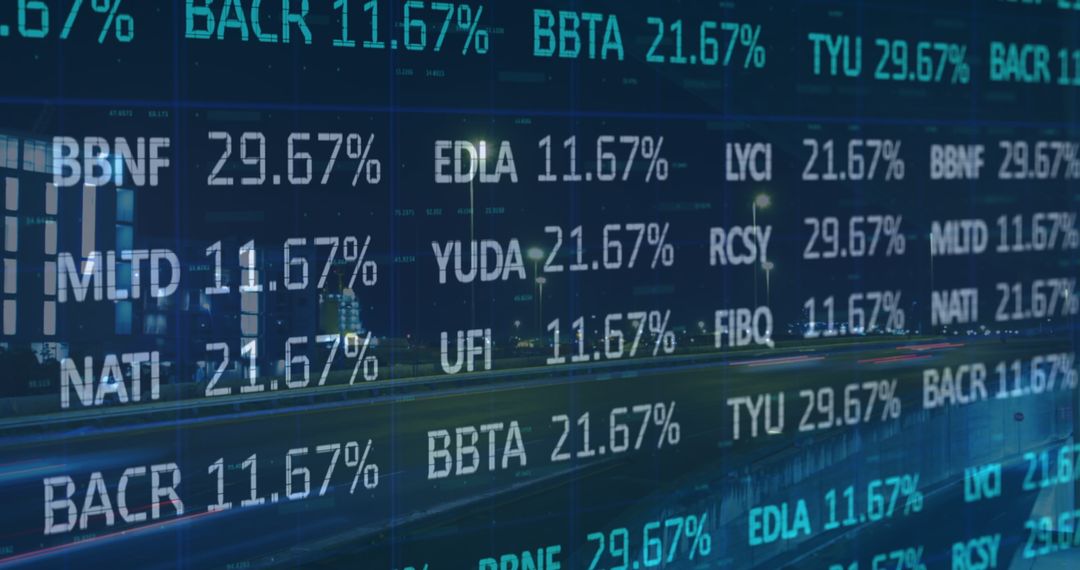
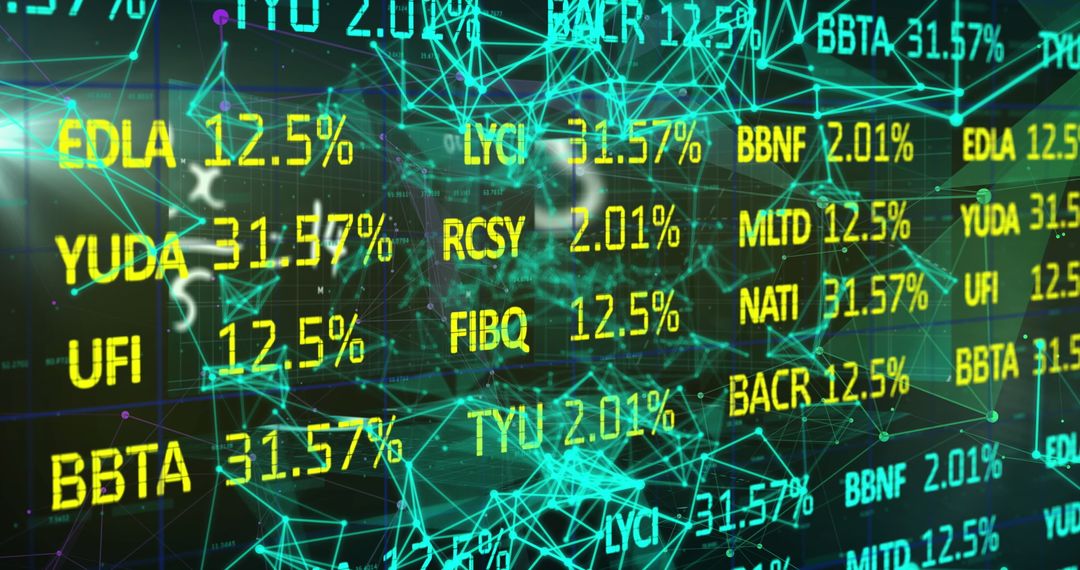
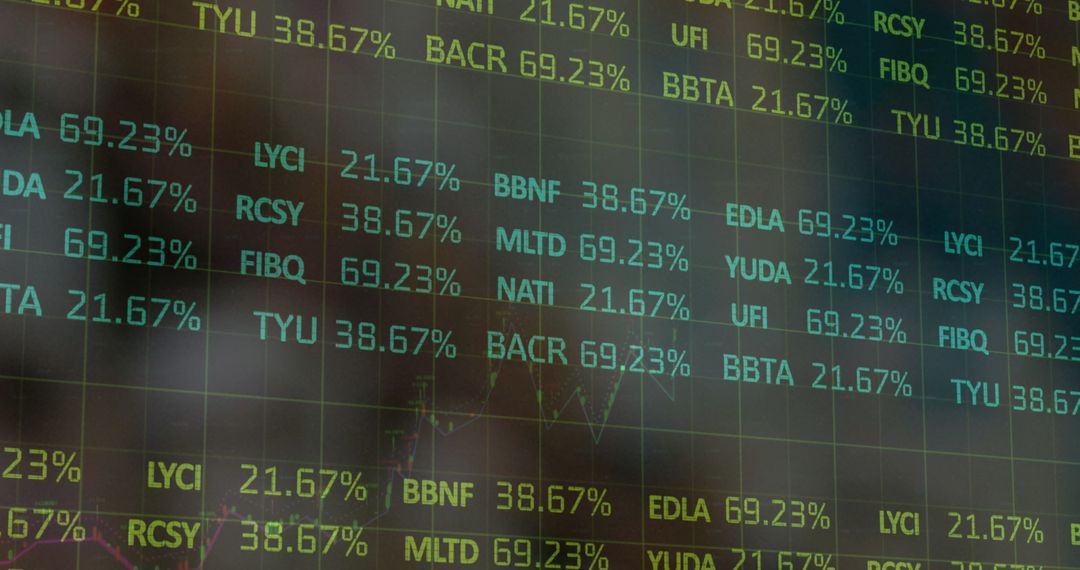
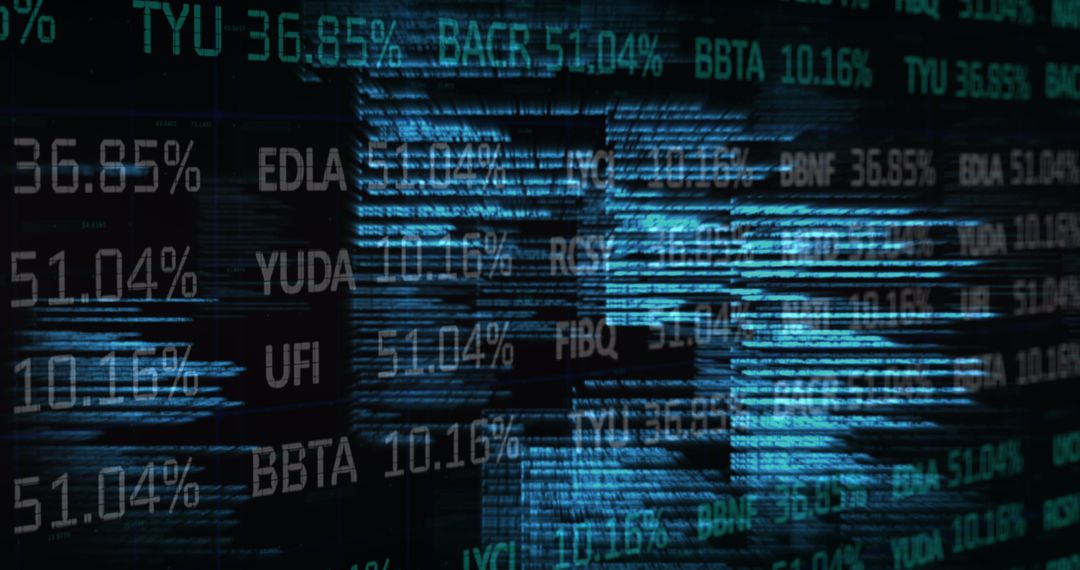
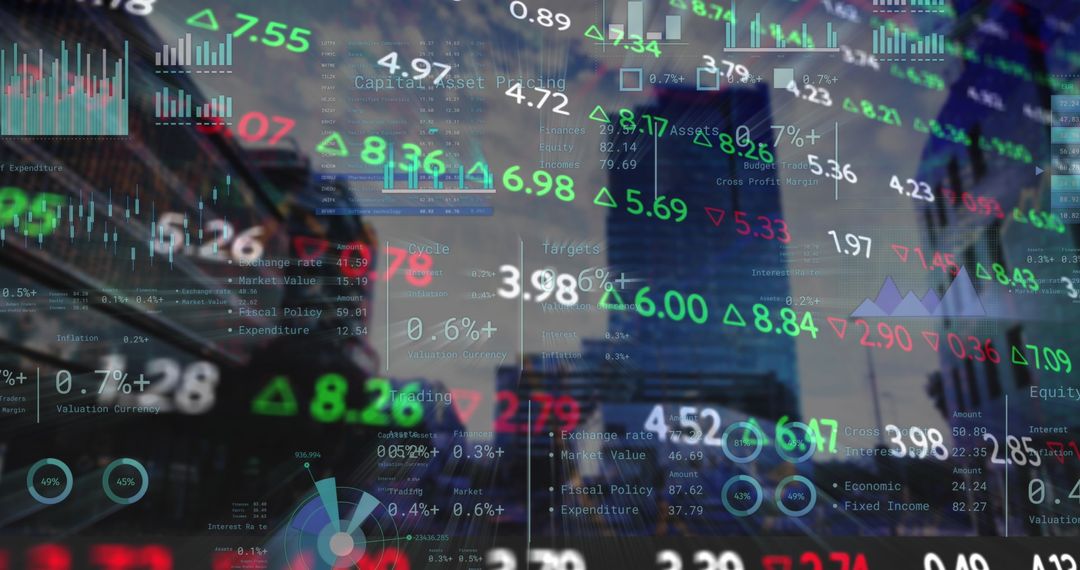
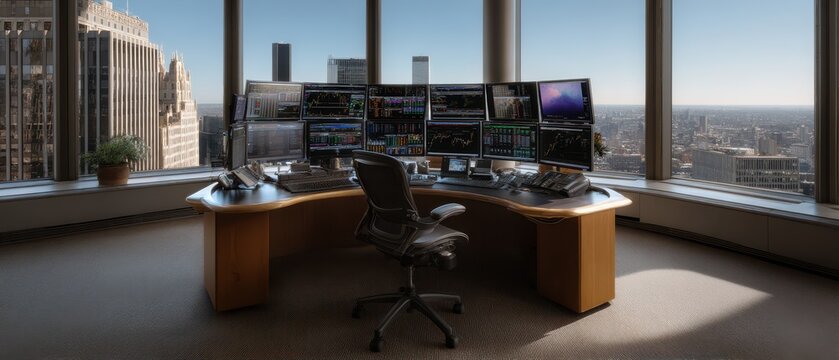
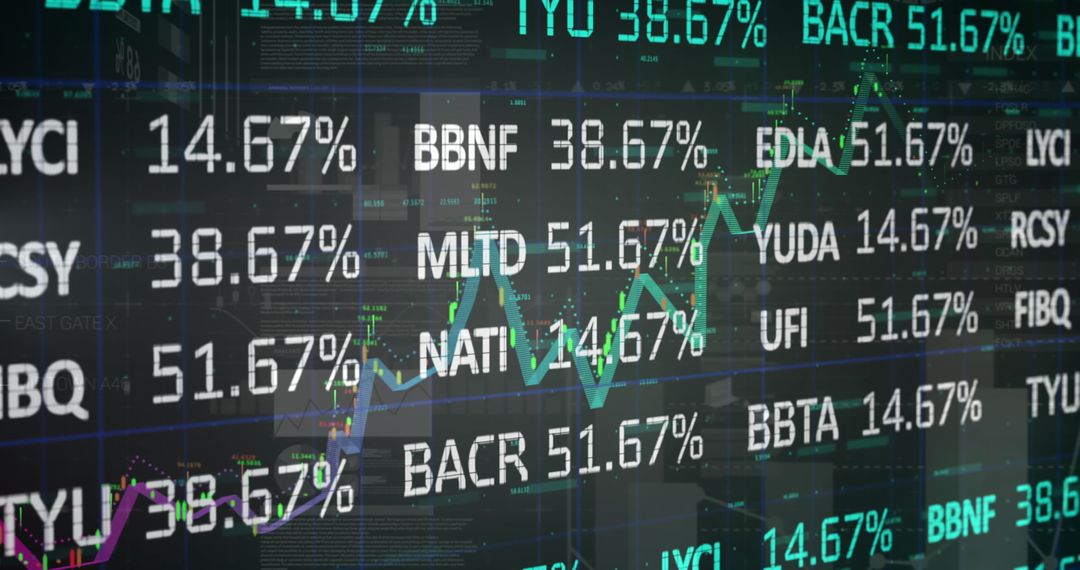
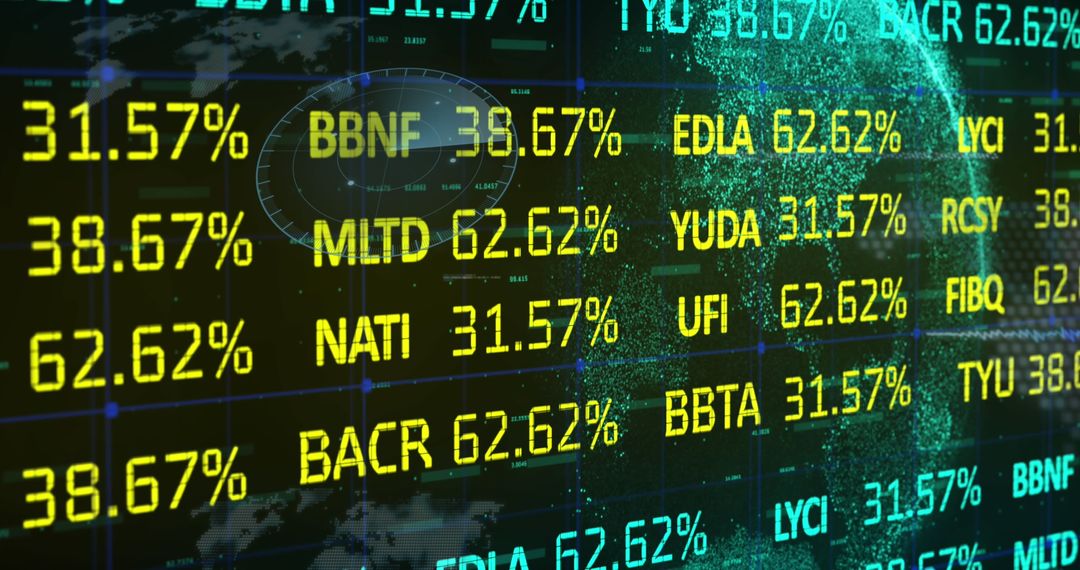
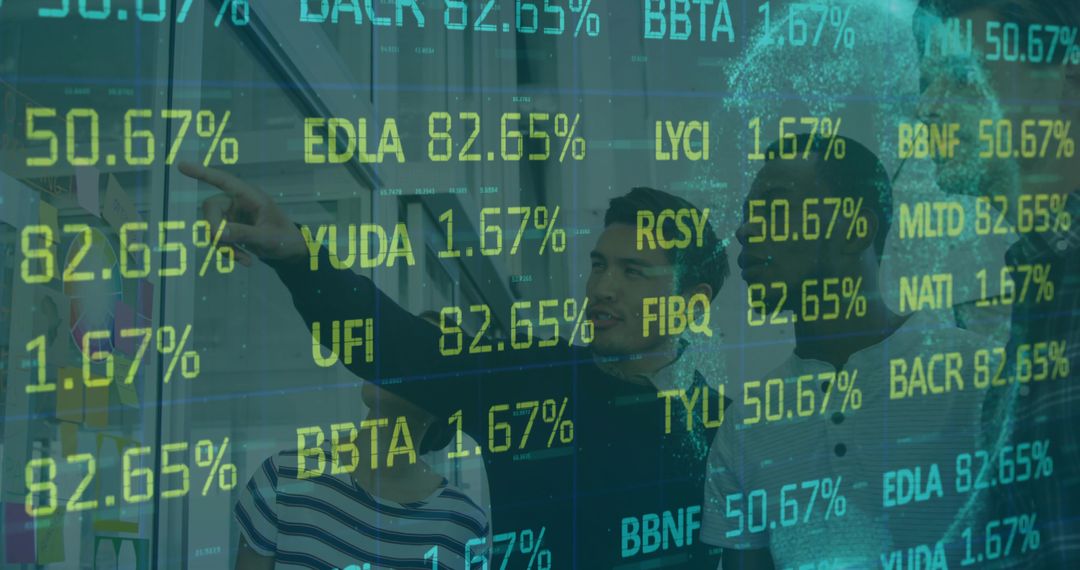
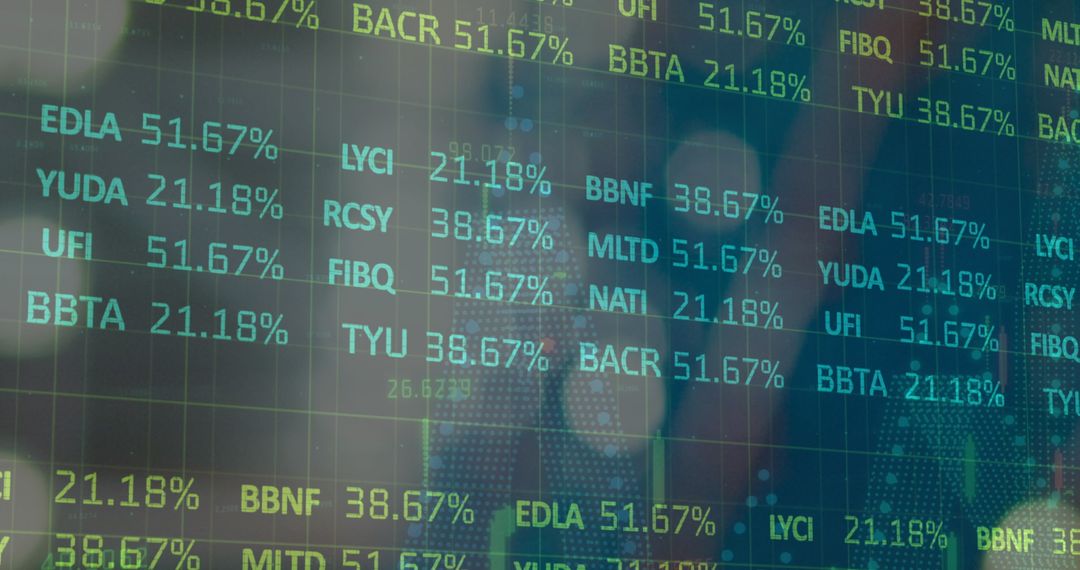
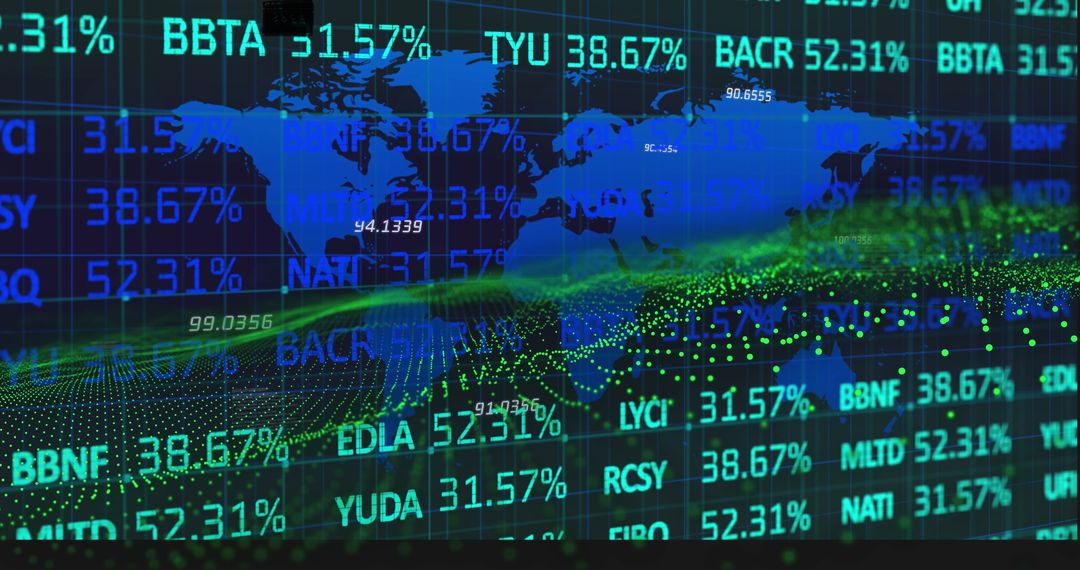
- Stock Tickers Displaying on Trading Desk Screen with Market Analysis Graph
Stock Tickers Displaying on Trading Desk Screen with Market Analysis Graph Image

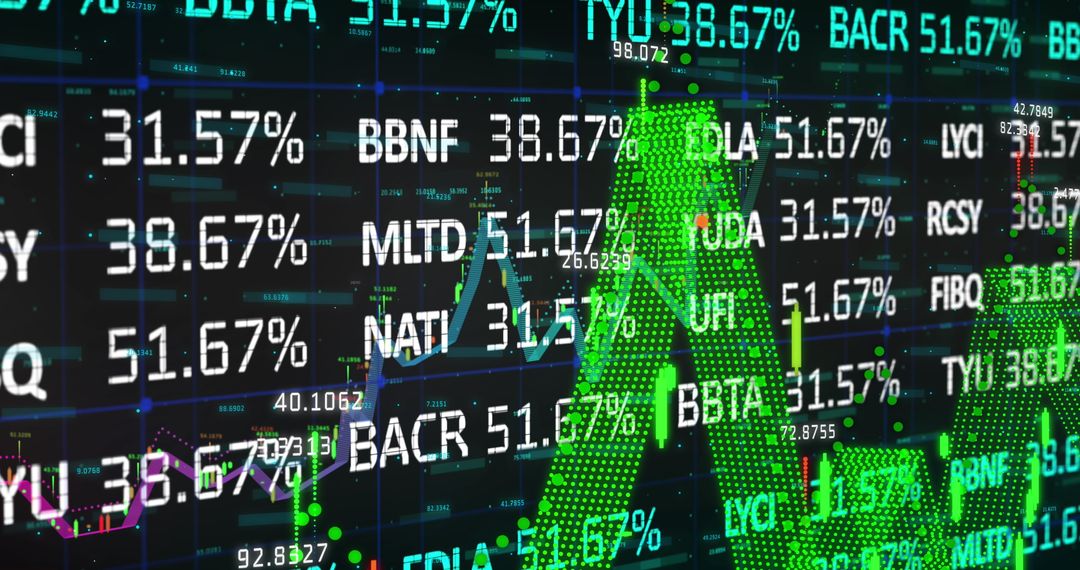
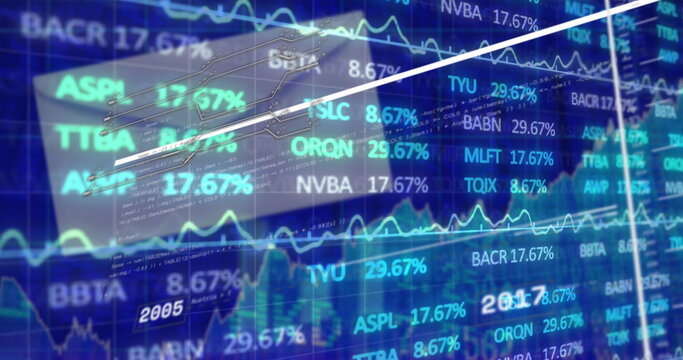
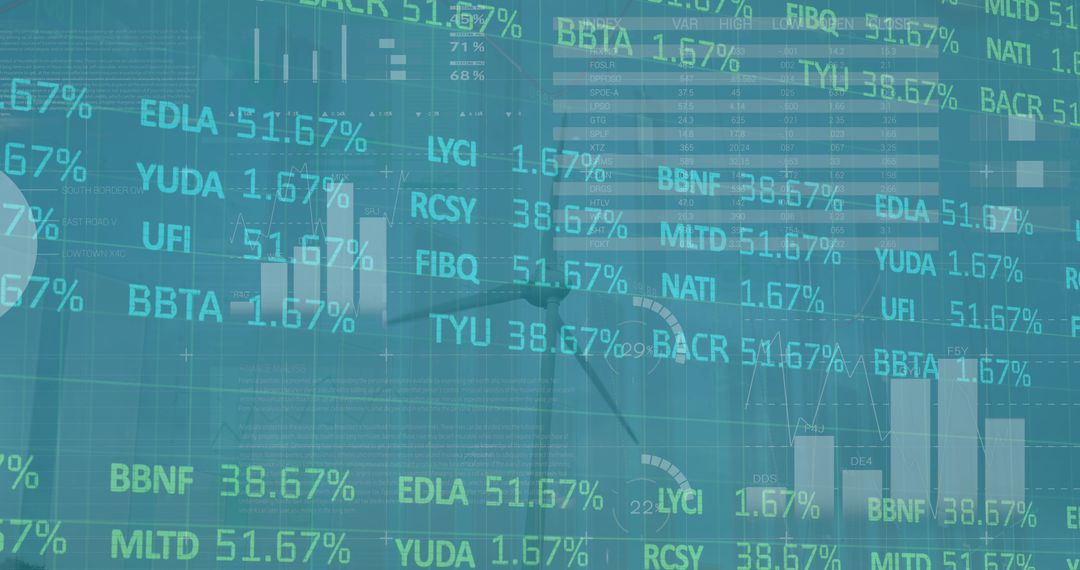
Digital display showing fluctuating stock prices and percentages with analytics graph overlayed, capturing dynamic nature of financial markets. Useful for financial reports, technology illustrations, and investment strategy presentations, illustrating fast-paced world of trading and analytics.
Powered by 


2
downloads
downloads
Tags:
More
Credit Photo
If you would like to credit the Photo, here are some ways you can do so
Text Link
photo Link
<span class="text-link">
<span>
<a target="_blank" href=https://pikwizard.com/photo/stock-tickers-displaying-on-trading-desk-screen-with-market-analysis-graph/a66dcce43d31b85c111aa14376fc65c0/>PikWizard</a>
</span>
</span>
<span class="image-link">
<span
style="margin: 0 0 20px 0; display: inline-block; vertical-align: middle; width: 100%;"
>
<a
target="_blank"
href="https://pikwizard.com/photo/stock-tickers-displaying-on-trading-desk-screen-with-market-analysis-graph/a66dcce43d31b85c111aa14376fc65c0/"
style="text-decoration: none; font-size: 10px; margin: 0;"
>
<img src="https://pikwizard.com/pw/medium/a66dcce43d31b85c111aa14376fc65c0.jpg" style="margin: 0; width: 100%;" alt="" />
<p style="font-size: 12px; margin: 0;">PikWizard</p>
</a>
</span>
</span>
Free (free of charge)
Free for personal and commercial use.
Author: Awesome Content
Similar Free Stock Images
Premium

Premium

Premium


Premium

Premium


Premium


Premium


Premium


Premium


Premium

Premium


Premium


Premium

Premium


Premium

Premium


Premium

Premium


Premium


Premium


Premium


Premium


Premium


Premium