- Home >
- Stock Photos >
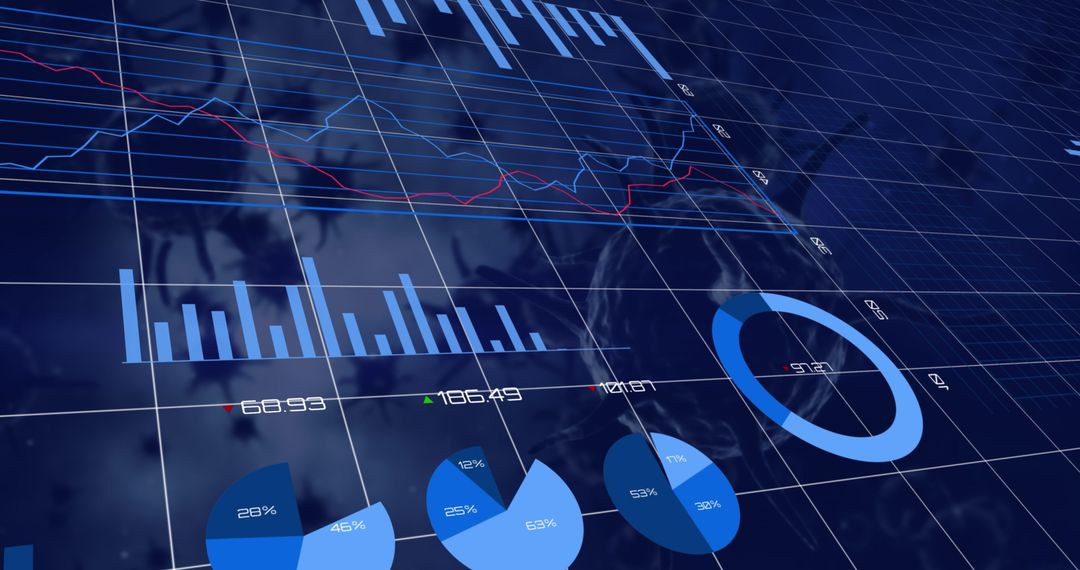
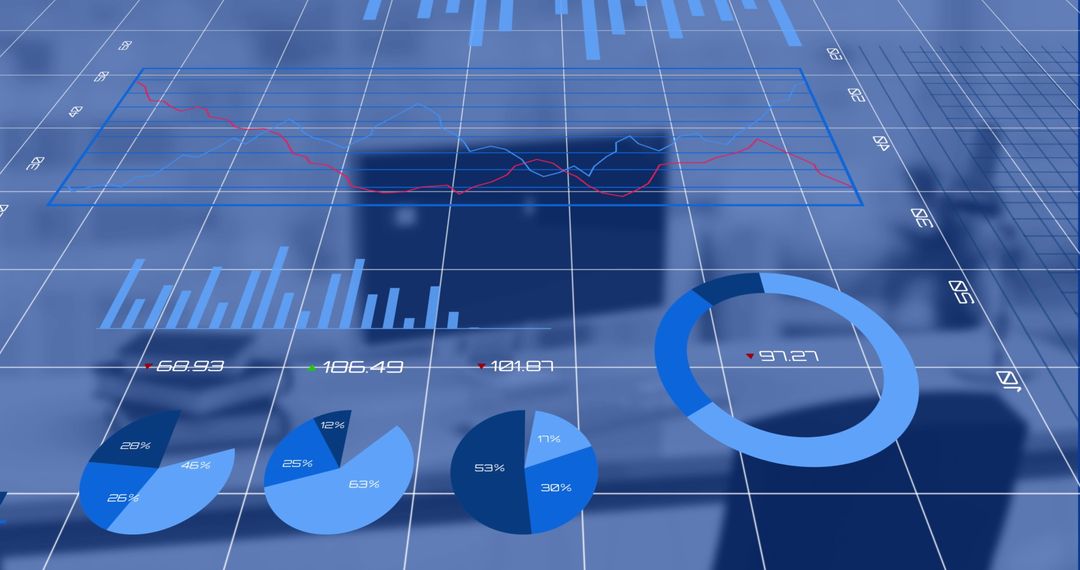
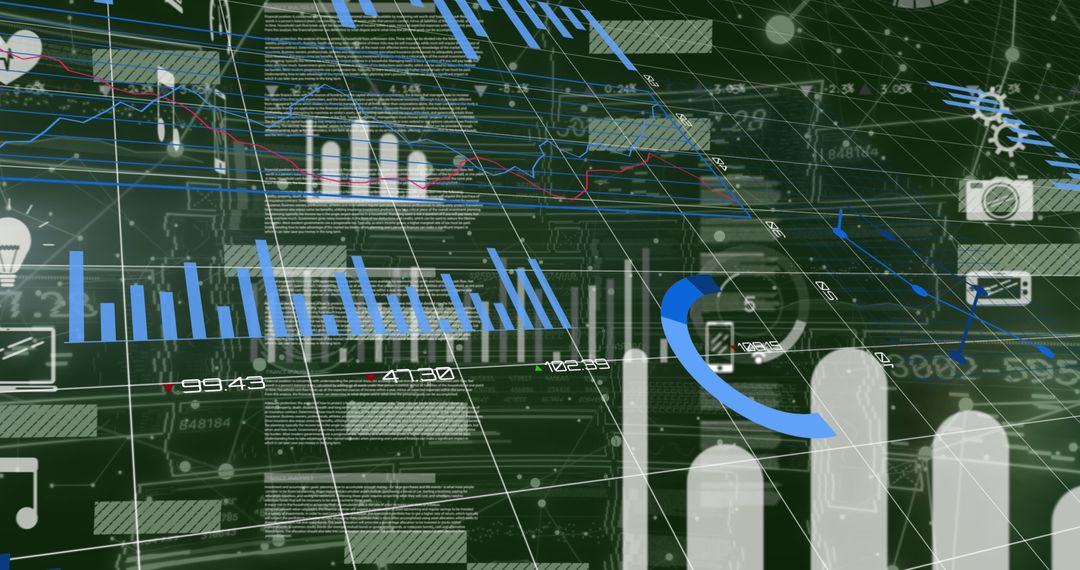
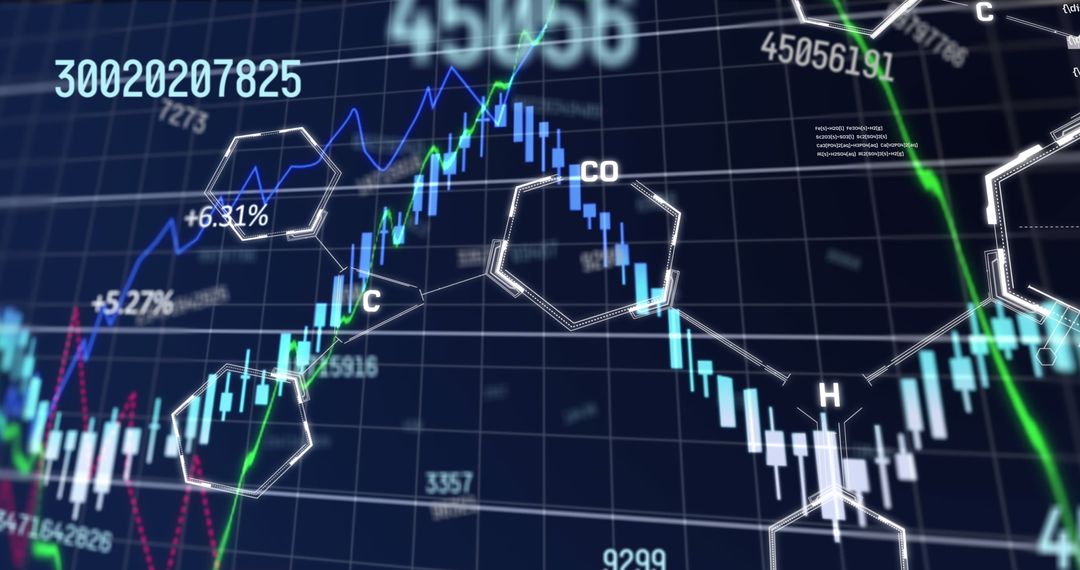
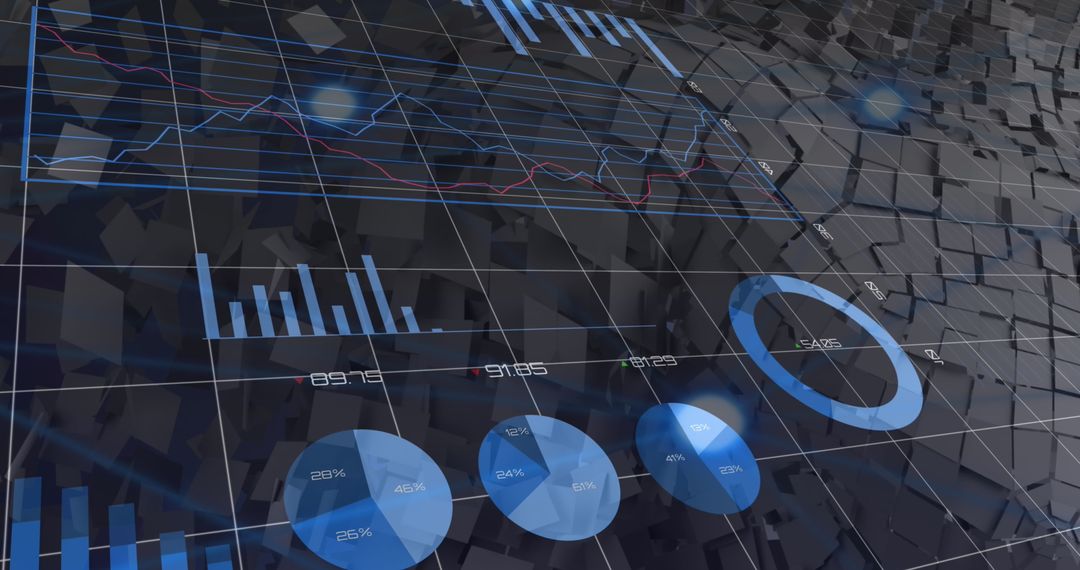
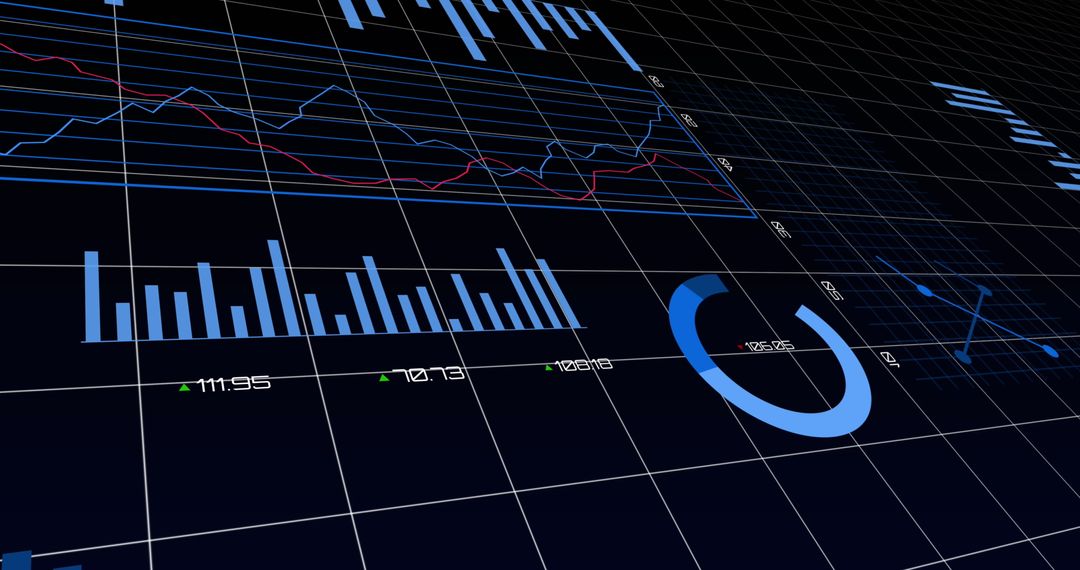
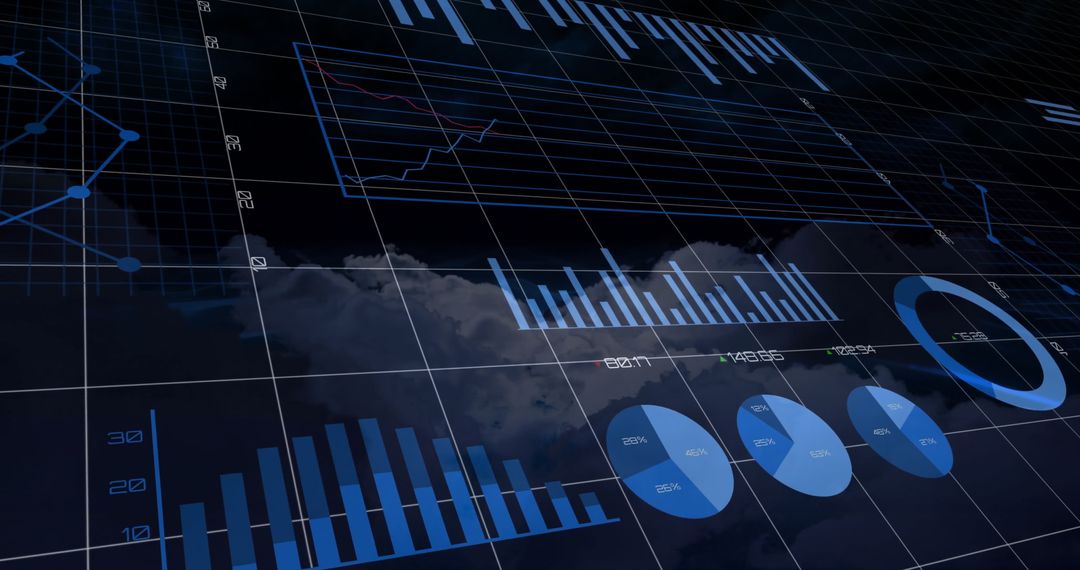
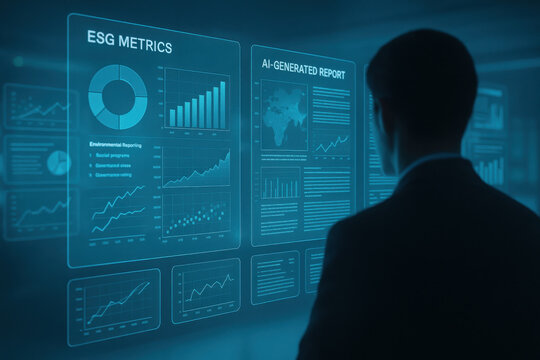
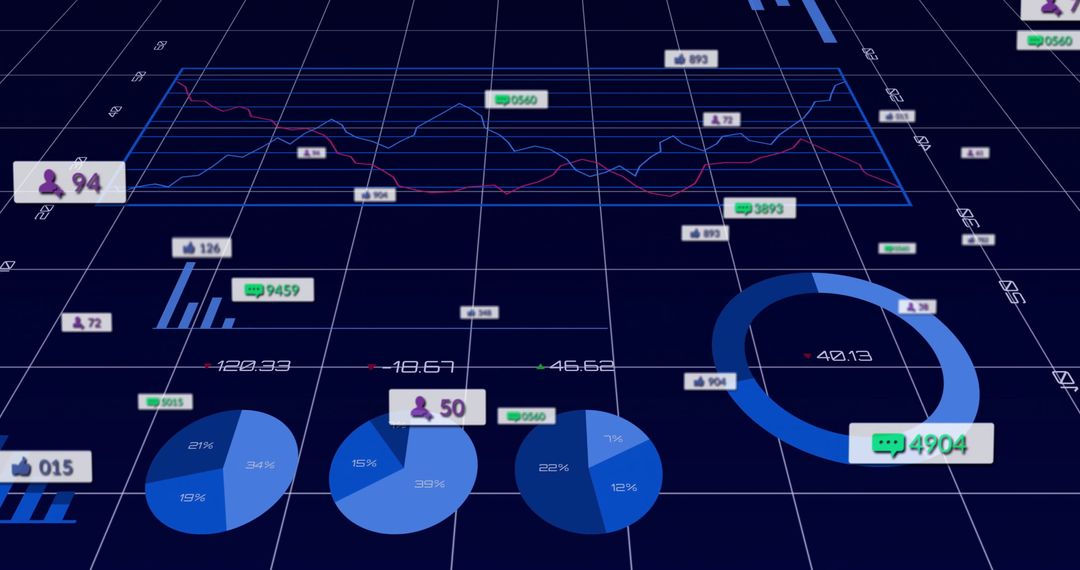
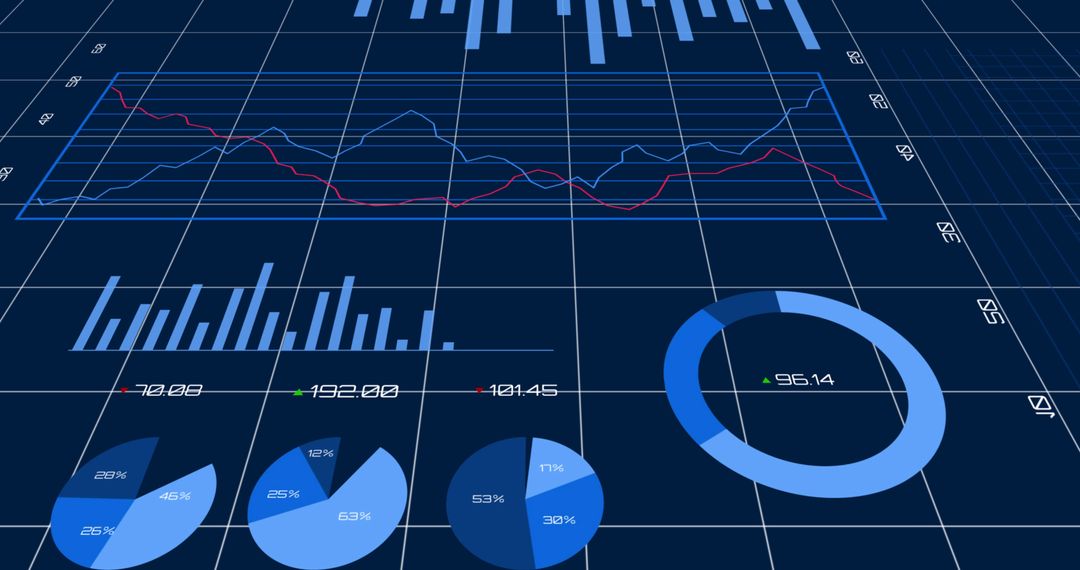
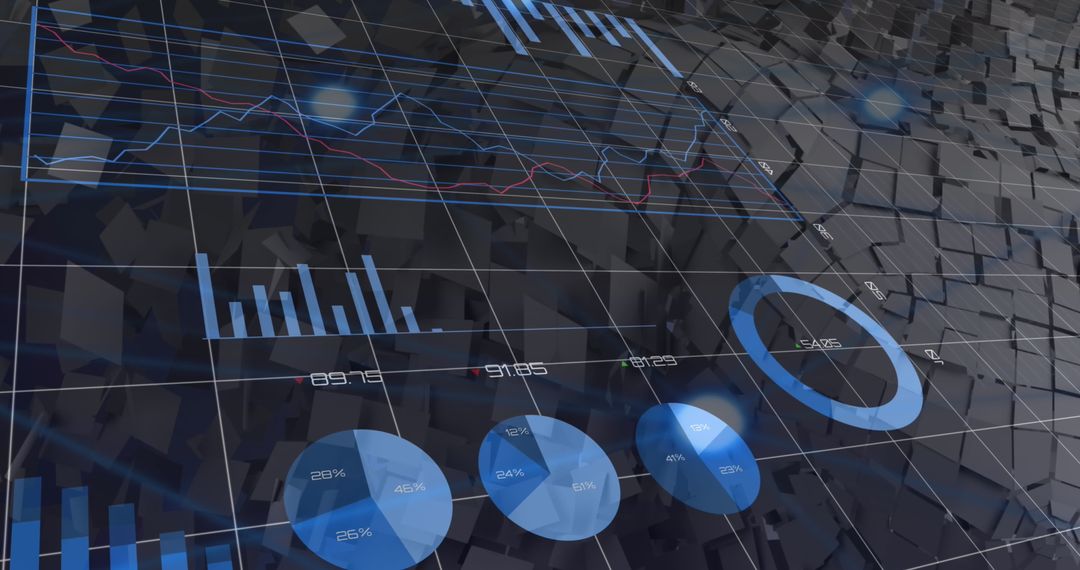
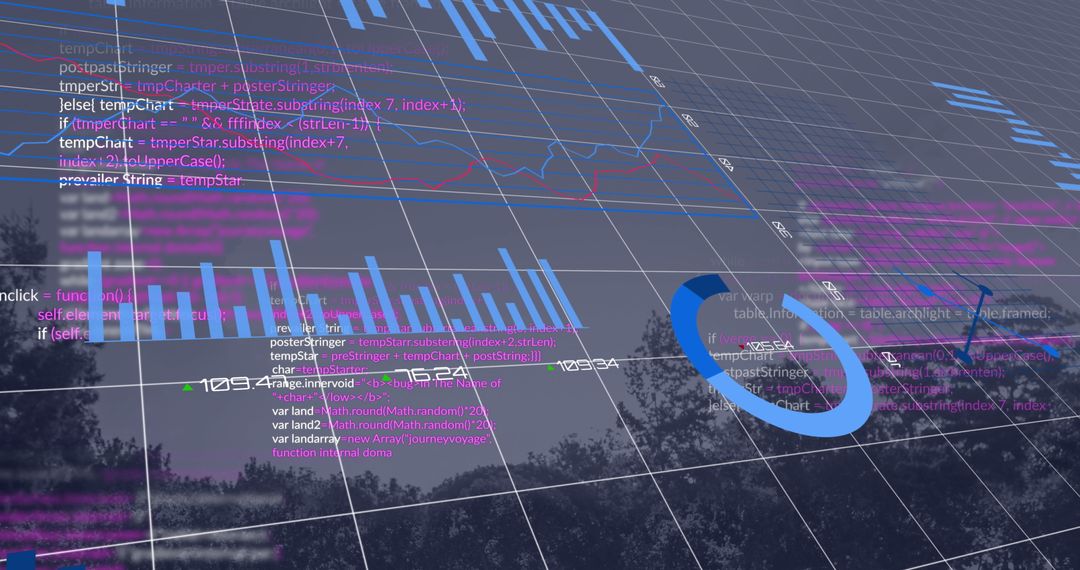
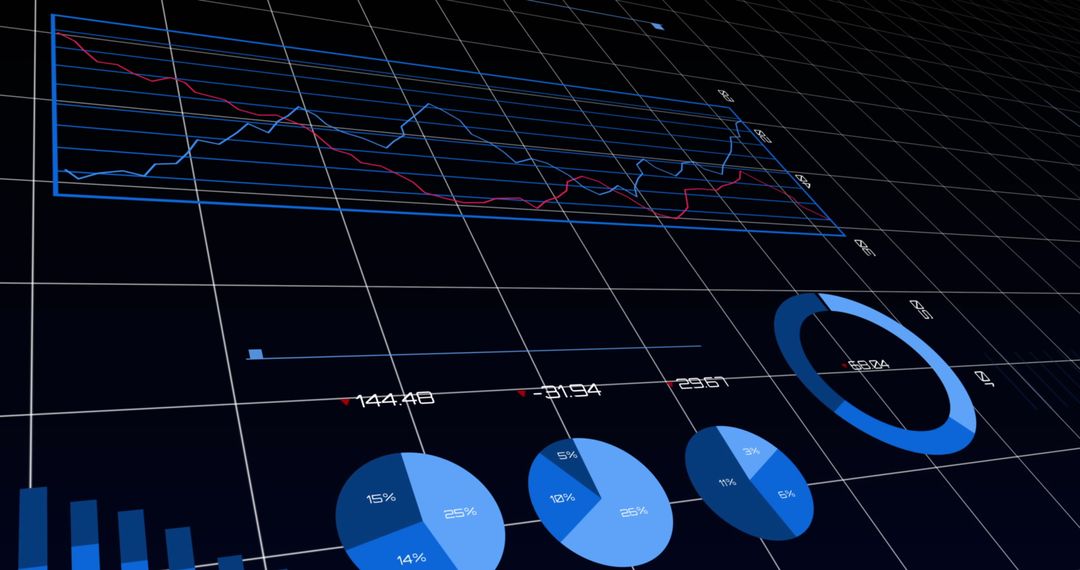
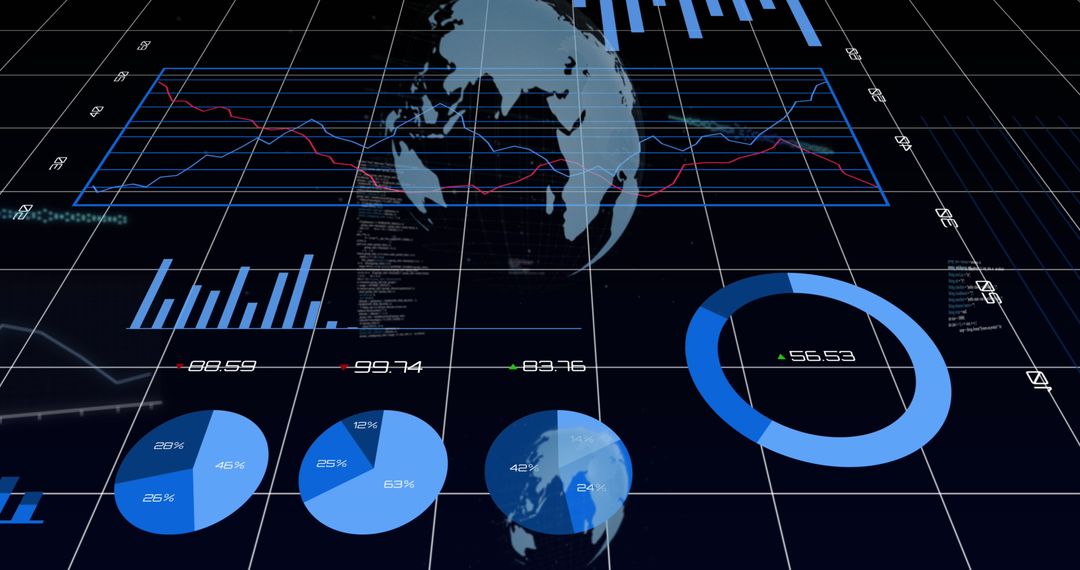
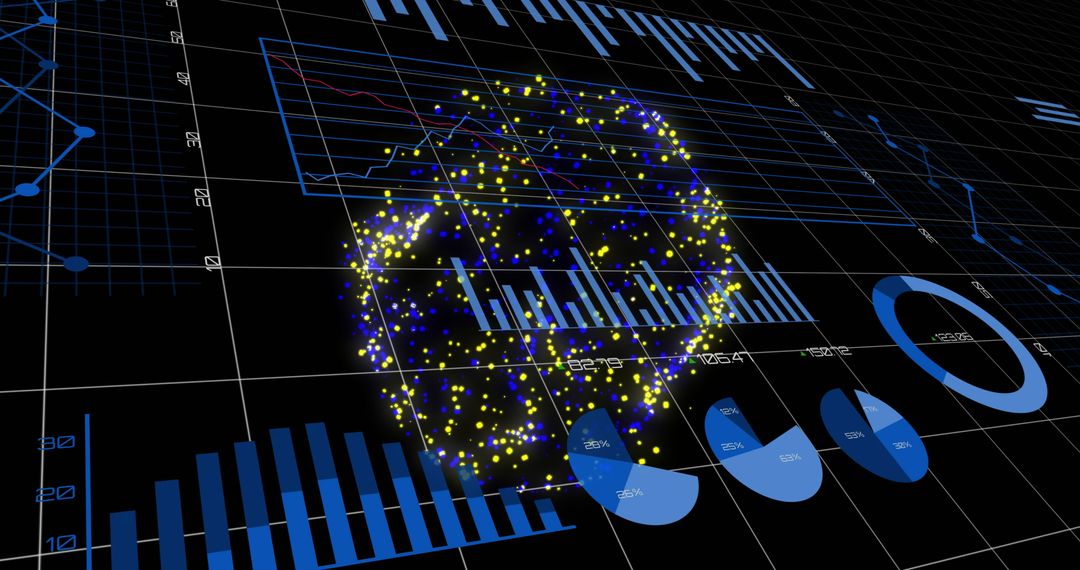
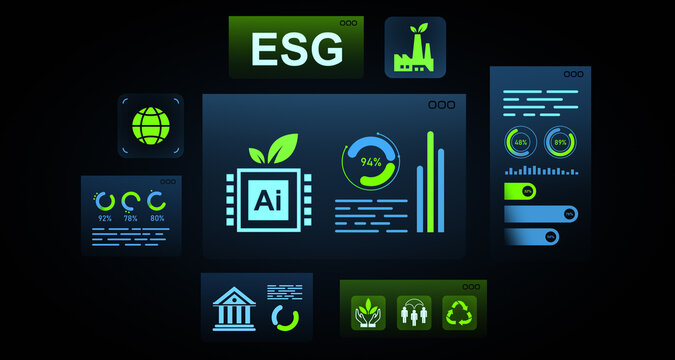
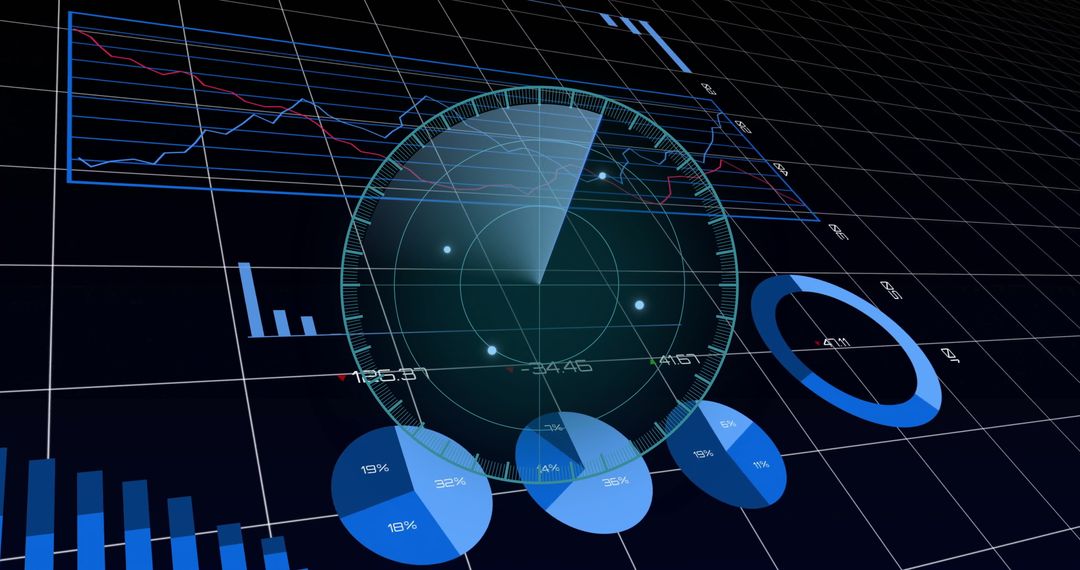
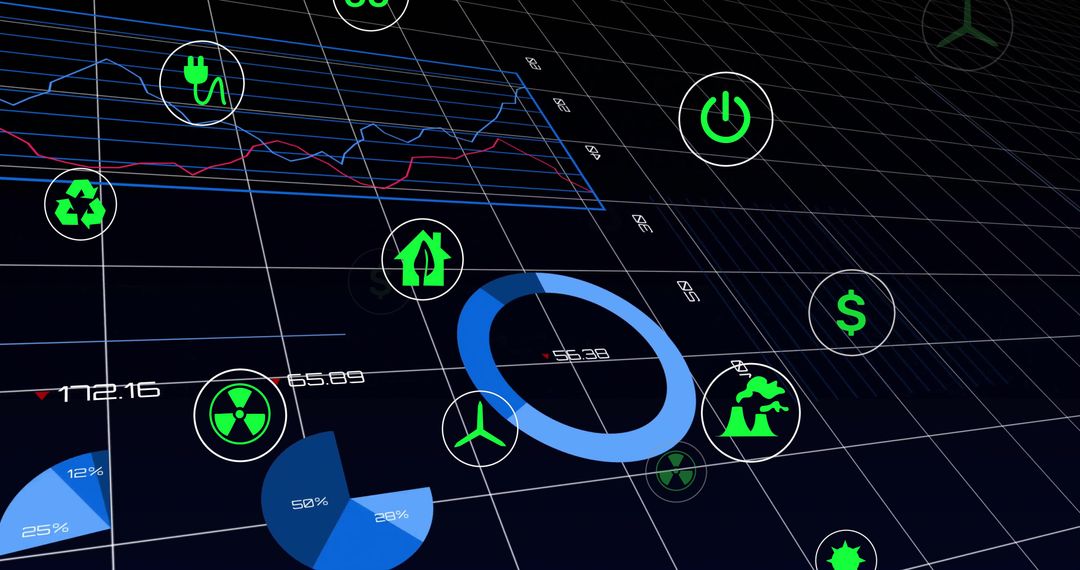
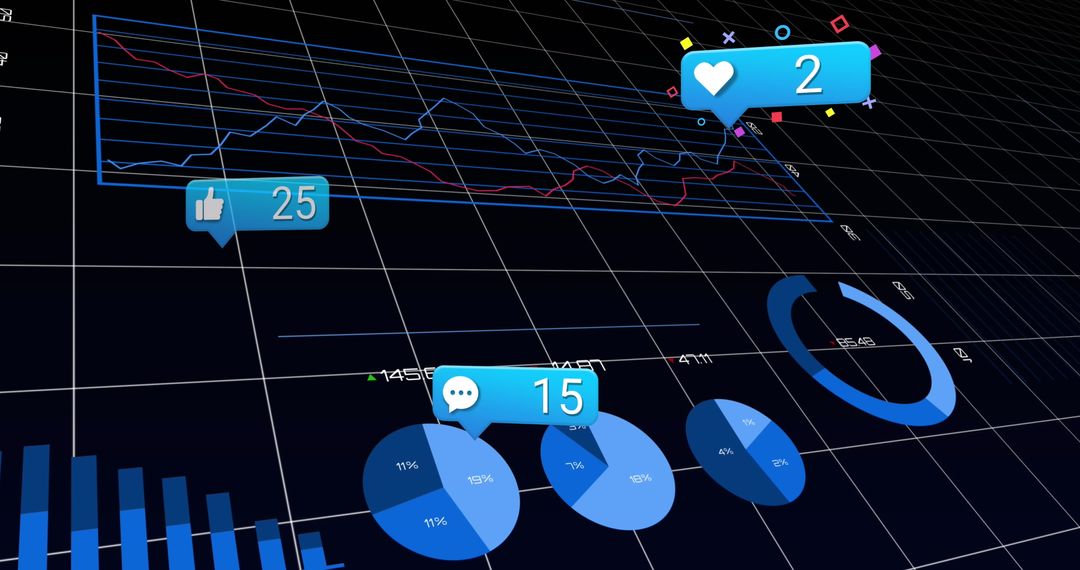
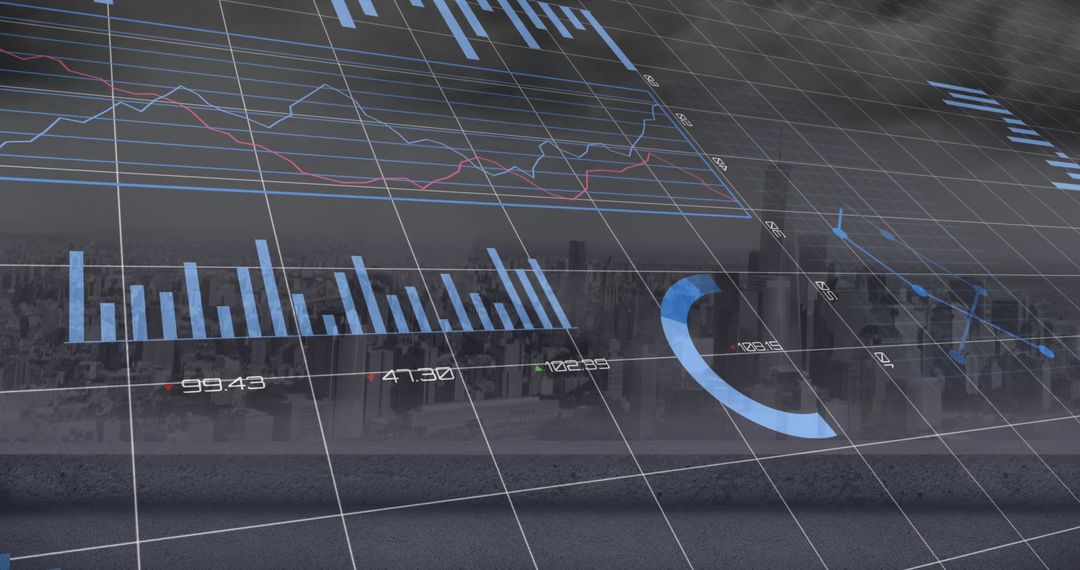
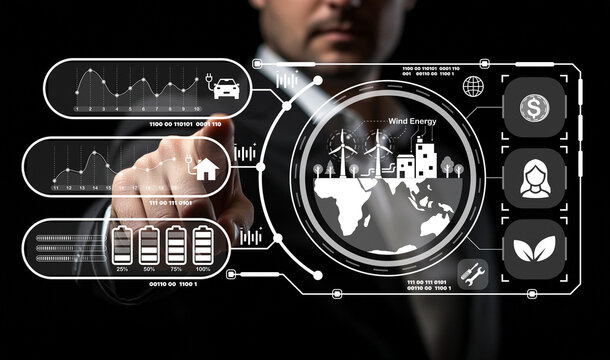
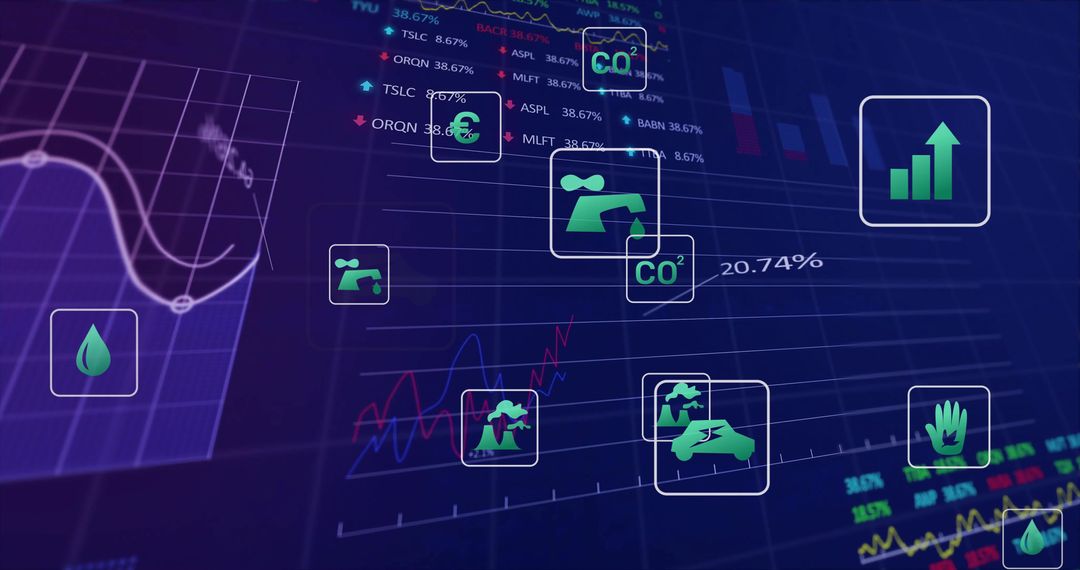
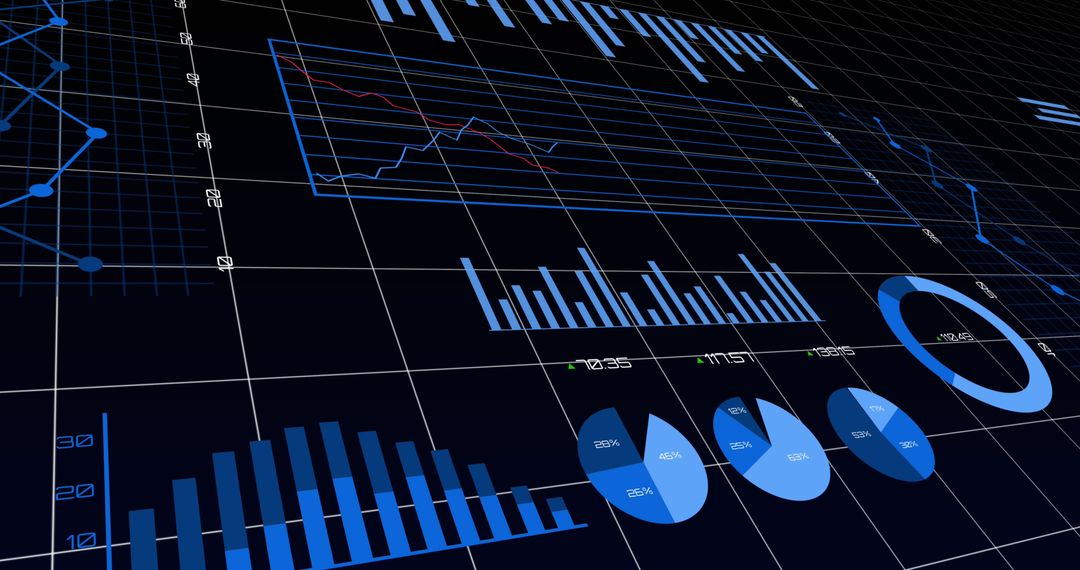
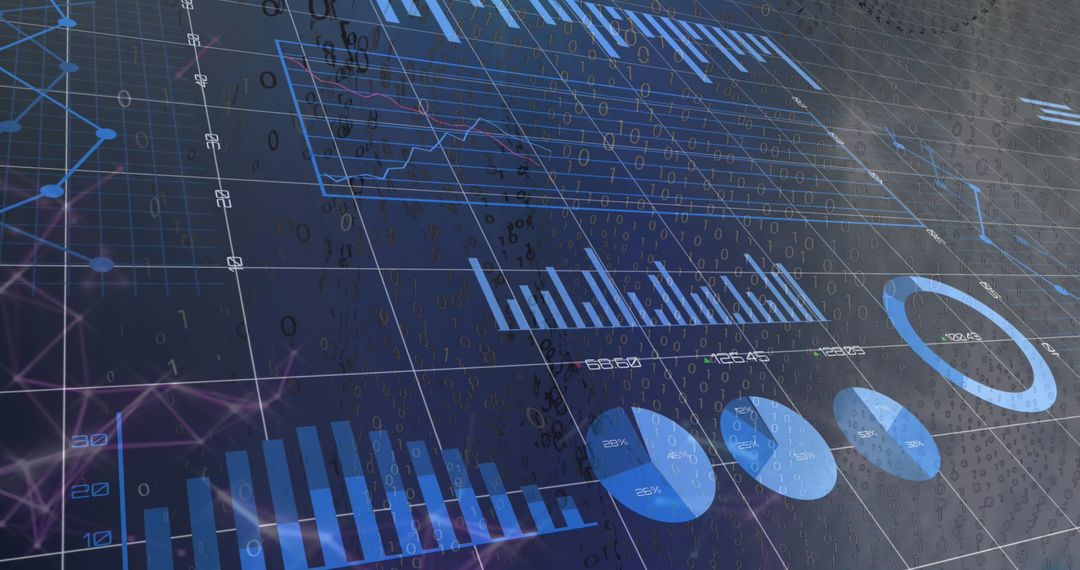
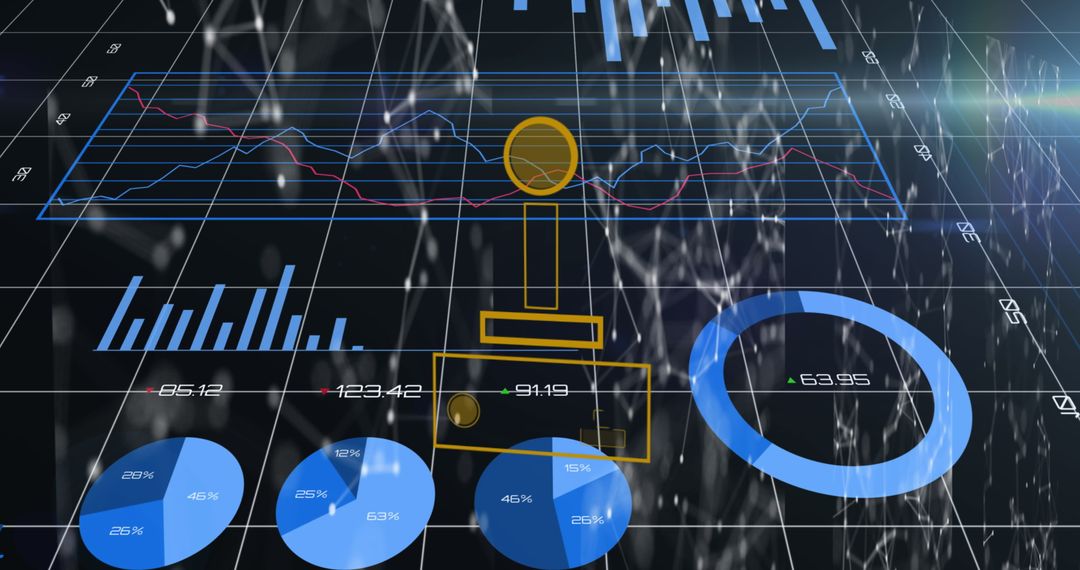
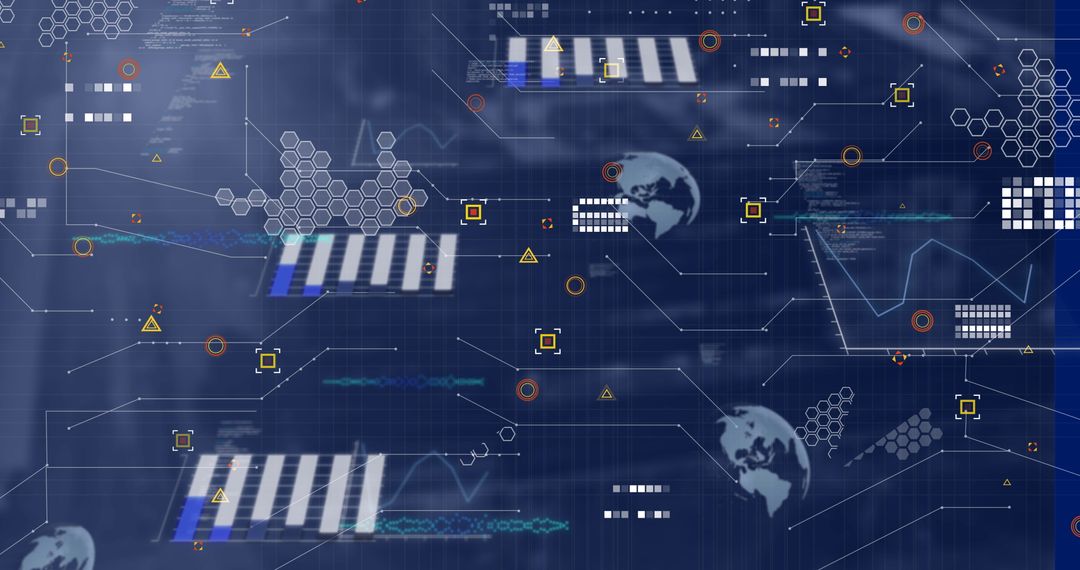
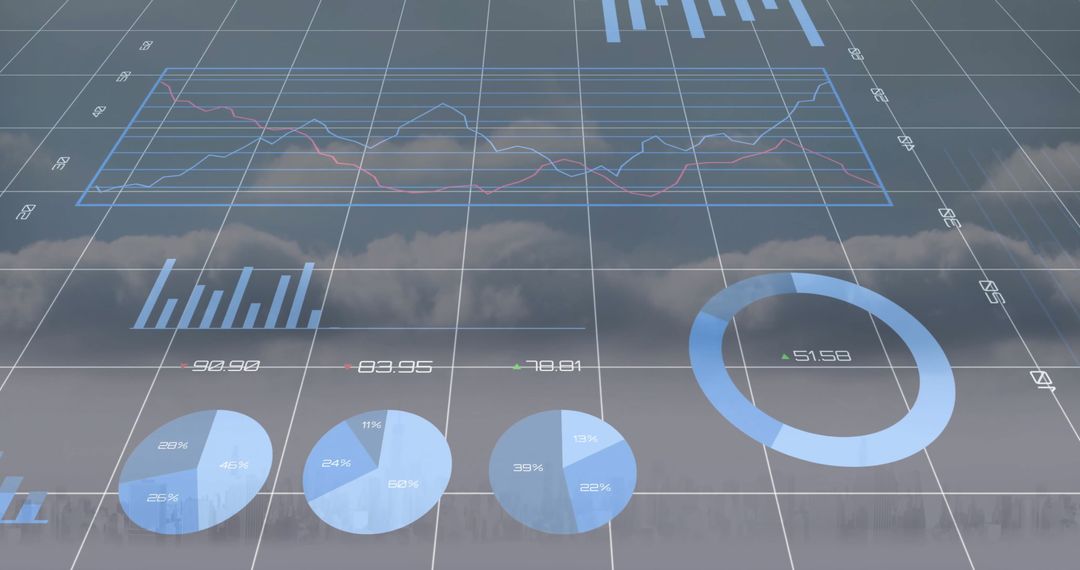
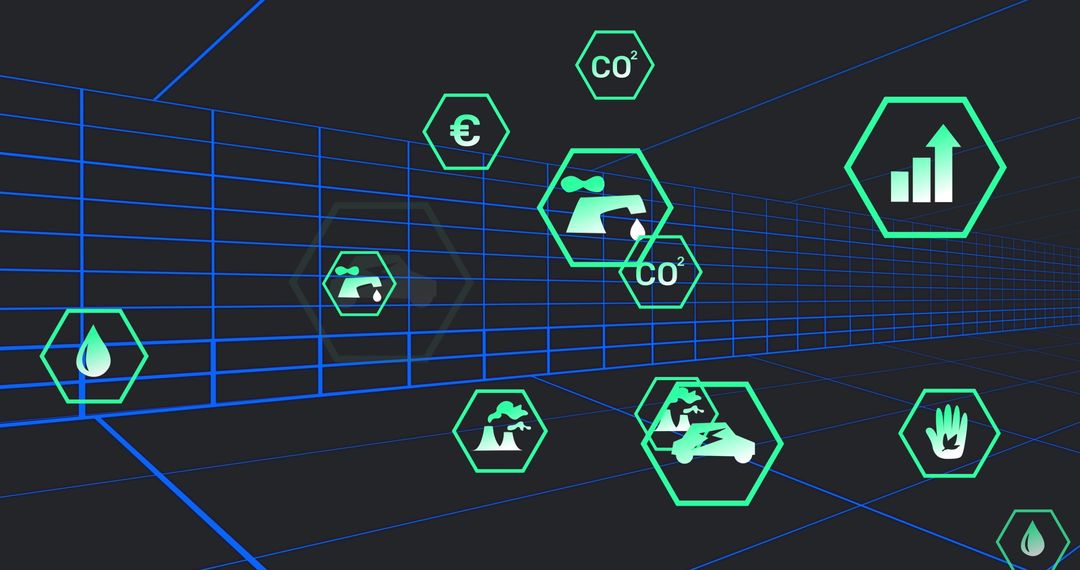
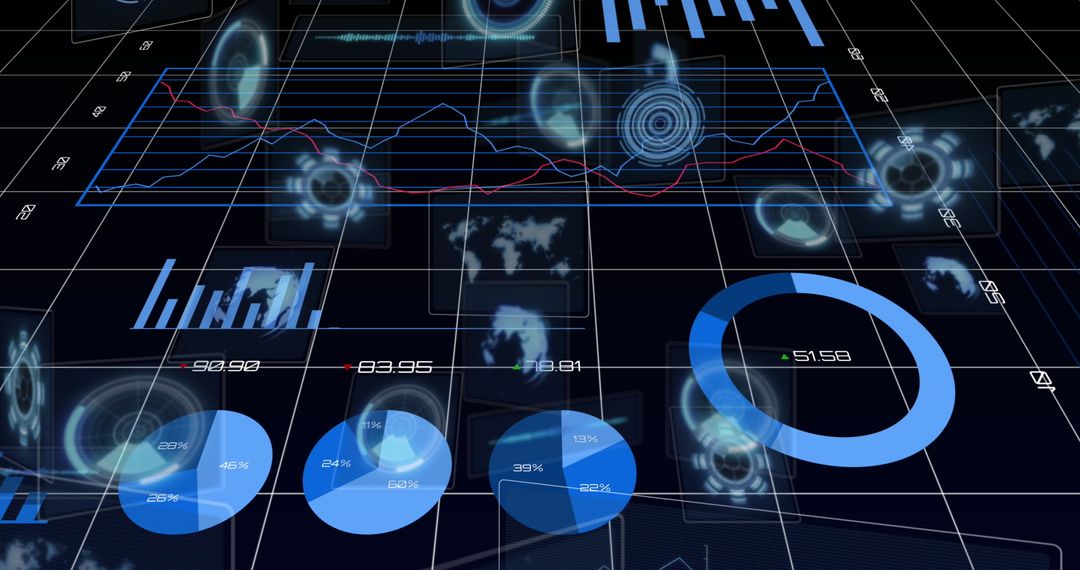
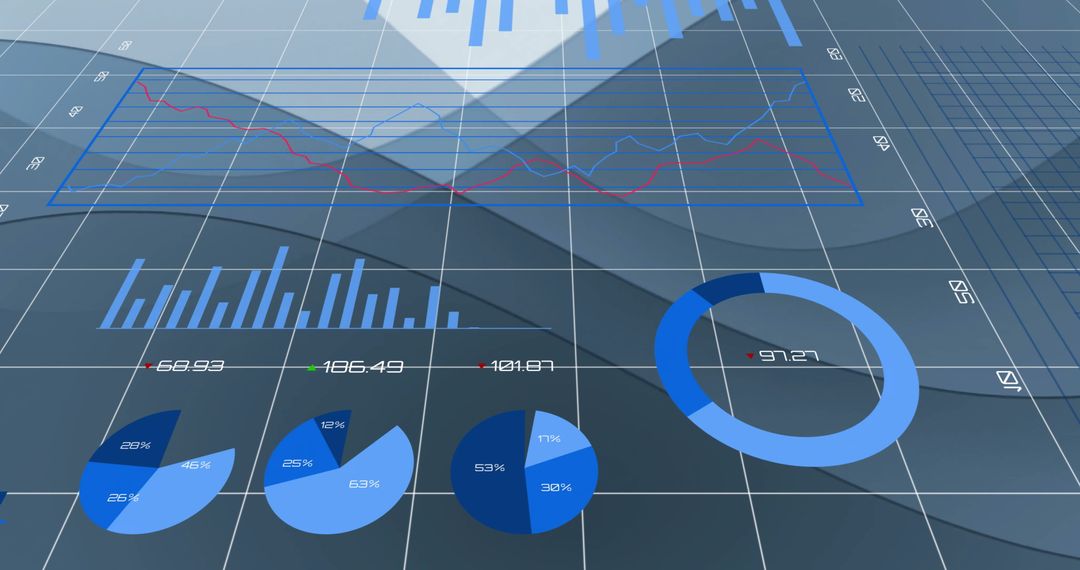
- Sustainability and Economic Data on Digital Dashboard Interface
Sustainability and Economic Data on Digital Dashboard Interface Image
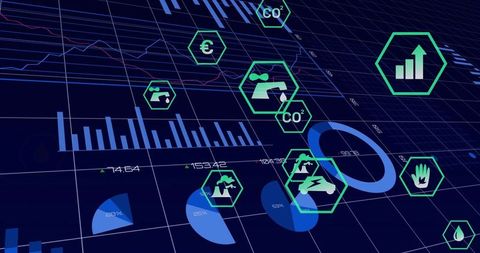
Hexagon icons and charts overlay a dynamic digital dashboard, visualizing sustainability concepts like CO? reduction and economic growth indicators. Useful for presentation material on environmental analytics, financial performance trends, technological advancements, and innovative sustainability strategies.
Powered by 


0
downloads
downloads
Tags:
More
Credit Photo
If you would like to credit the Photo, here are some ways you can do so
Text Link
photo Link
<span class="text-link">
<span>
<a target="_blank" href=https://pikwizard.com/photo/sustainability-and-economic-data-on-digital-dashboard-interface/95aa19552c7a36d336ebbeced41850ab/>PikWizard</a>
</span>
</span>
<span class="image-link">
<span
style="margin: 0 0 20px 0; display: inline-block; vertical-align: middle; width: 100%;"
>
<a
target="_blank"
href="https://pikwizard.com/photo/sustainability-and-economic-data-on-digital-dashboard-interface/95aa19552c7a36d336ebbeced41850ab/"
style="text-decoration: none; font-size: 10px; margin: 0;"
>
<img src="https://pikwizard.com/pw/medium/95aa19552c7a36d336ebbeced41850ab.jpg" style="margin: 0; width: 100%;" alt="" />
<p style="font-size: 12px; margin: 0;">PikWizard</p>
</a>
</span>
</span>
Free (free of charge)
Free for personal and commercial use.
Author: Creative Art
Similar Free Stock Images
Premium


Premium

Premium

Premium

Premium
Premium


Premium

Premium


Premium


Premium

Premium

Premium


Premium


Premium


Premium

Premium


Premium
Premium


Premium

Premium


Premium

Premium

Premium


Premium