- Home >
- Stock Photos >
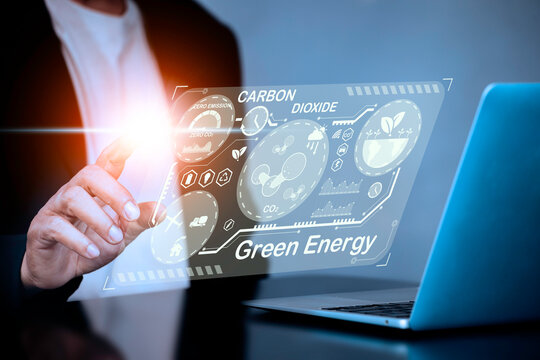
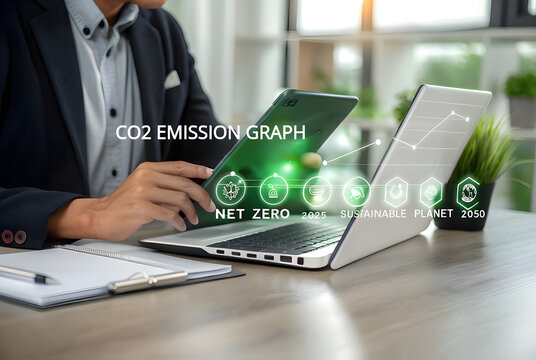
- Sustainability Finance Dashboard Displaying CO2 Emissions, Euro Trends and Growth Metrics
Sustainability Finance Dashboard Displaying CO2 Emissions, Euro Trends and Growth Metrics Image

Showing dark blue grid background with green, blue and magenta line charts and overlay icons for CO2, euro, electric vehicle, leaf-hand and rising bar chart. Illustrating emission trends, currency movement and market volatility with percentage markers such as +7.12% and glowing interface accents. Combining clean, tech-forward visual style with sustainability and finance themes. Working well for sustainable finance presentations, ESG reports, investor pitch decks, fintech dashboards, annual reports and marketing for green funds. Pairing with headlines about carbon reduction, green investing, renewable energy growth, market performance and ESG metrics. Suitable for website hero, blog header, social media post, investor newsletter and conference slides.
Powered by 


0
downloads
downloads
Tags:
More
Credit Photo
If you would like to credit the Photo, here are some ways you can do so
Text Link
photo Link
<span class="text-link">
<span>
<a target="_blank" href=https://pikwizard.com/photo/sustainability-finance-dashboard-displaying-co2-emissions-euro-trends-and-growth-metrics/2b3c20acba4898d37cba9f5f3a9b9d8b/>PikWizard</a>
</span>
</span>
<span class="image-link">
<span
style="margin: 0 0 20px 0; display: inline-block; vertical-align: middle; width: 100%;"
>
<a
target="_blank"
href="https://pikwizard.com/photo/sustainability-finance-dashboard-displaying-co2-emissions-euro-trends-and-growth-metrics/2b3c20acba4898d37cba9f5f3a9b9d8b/"
style="text-decoration: none; font-size: 10px; margin: 0;"
>
<img src="https://pikwizard.com/pw/medium/2b3c20acba4898d37cba9f5f3a9b9d8b.jpg" style="margin: 0; width: 100%;" alt="" />
<p style="font-size: 12px; margin: 0;">PikWizard</p>
</a>
</span>
</span>
Free (free of charge)
Free for personal and commercial use.
Author: Creative Art
Similar Free Stock Images

Premium


Premium


Premium


Premium


Premium


Premium


Premium