
- Home >
- Stock Photos >
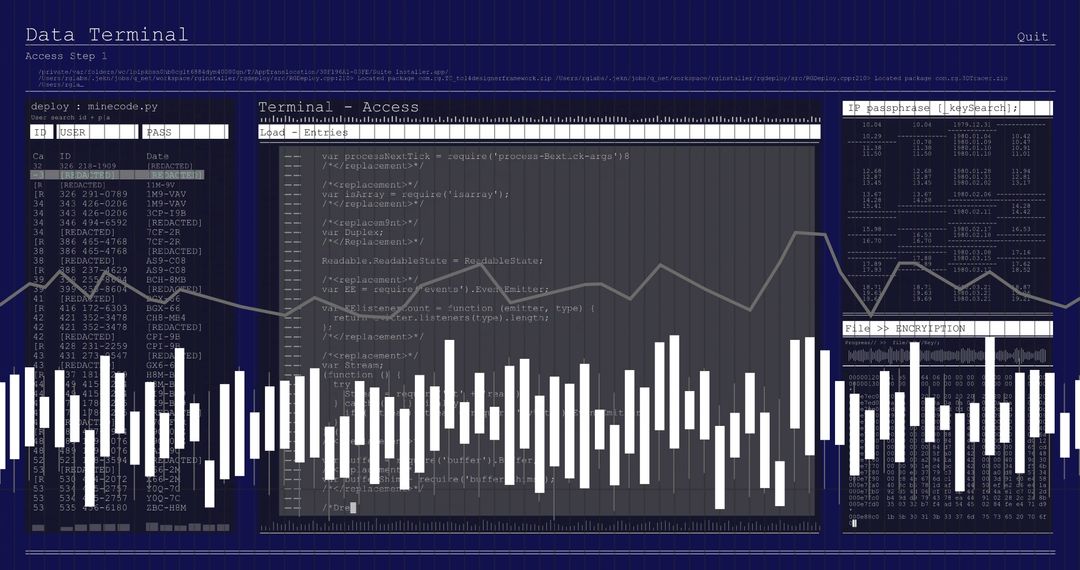
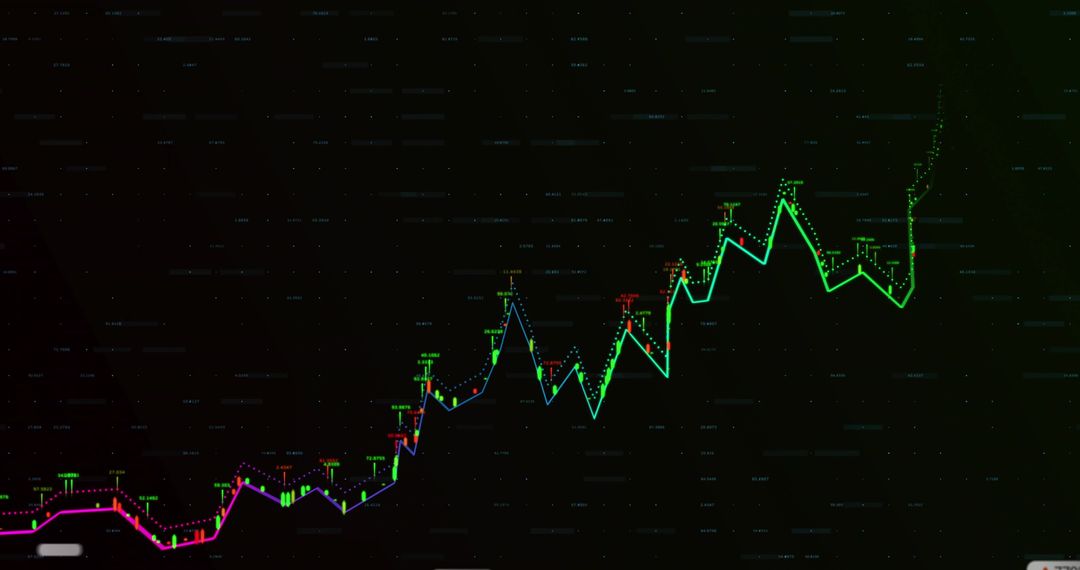
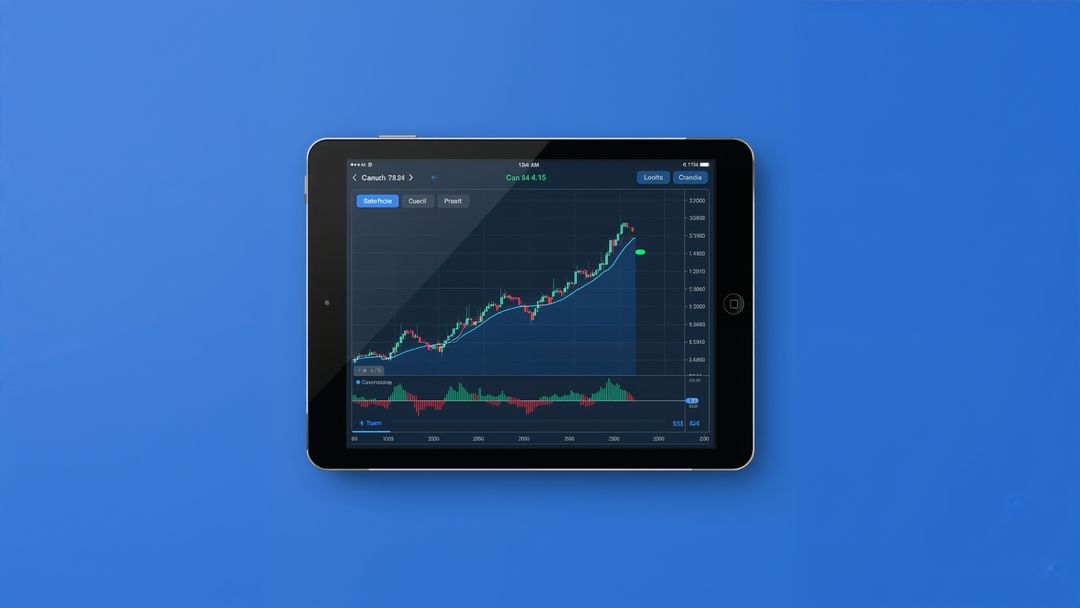
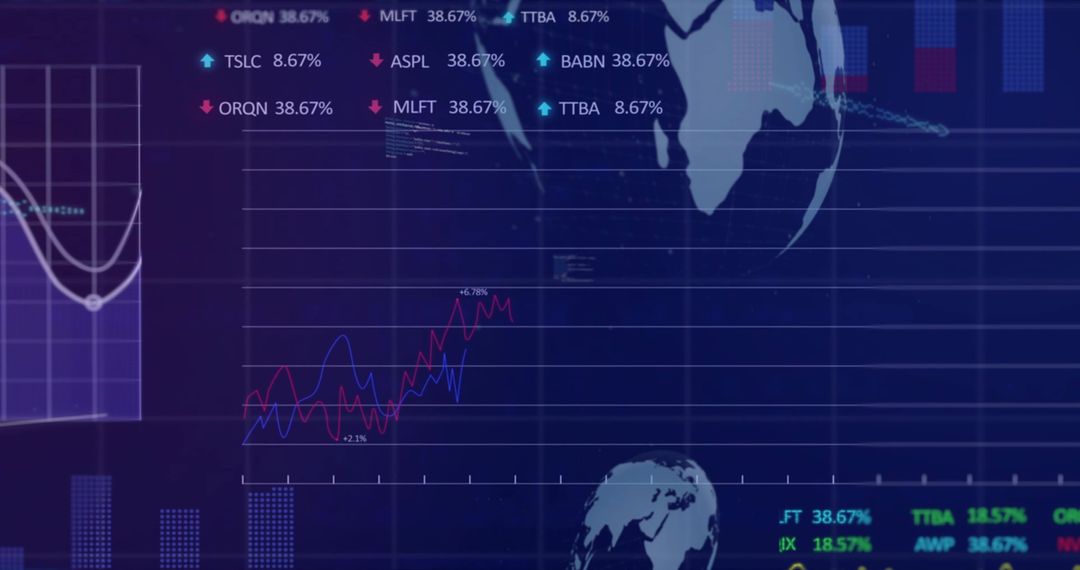
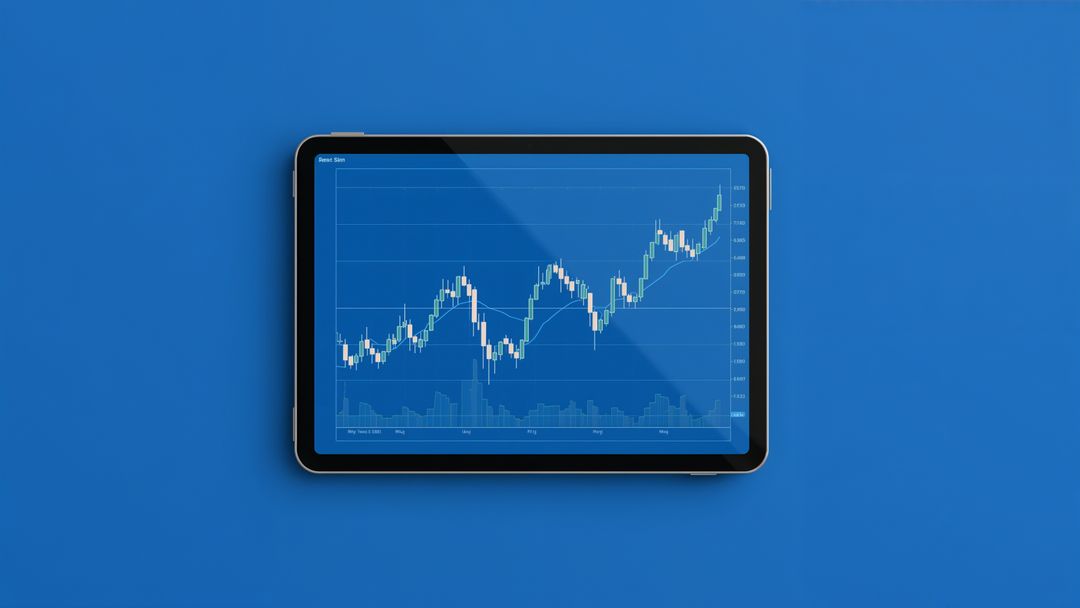
- Tablet Displaying Bitcoin Candlestick Chart on Blue Background
Tablet Displaying Bitcoin Candlestick Chart on Blue Background Image
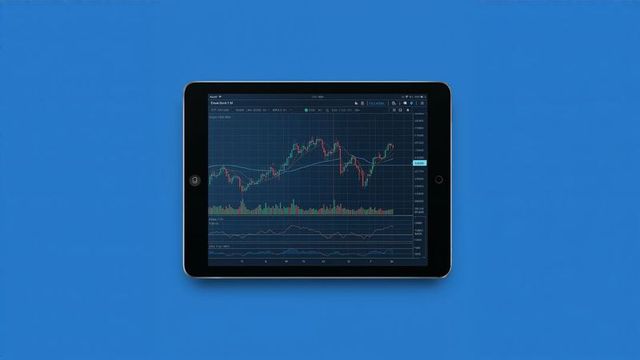
AI Generated Image. Image depicts a tablet showing a Bitcoin candlestick chart on a blue background. Useful for illustrating financial analytics, cryptocurrency market trends, and digital trading interfaces. Perfect for articles on cryptocurrency news, market predictions, AI in trading technology, or financial education resources.
Powered by  - Get 15% off with code: PIKWIZARD15


0
downloads
downloads
Tags:
More
Credit Photo
If you would like to credit the Photo, here are some ways you can do so
Text Link
photo Link
<span class="text-link">
<span>
<a target="_blank" href=https://pikwizard.com/photo/tablet-displaying-bitcoin-candlestick-chart-on-blue-background/8b02d5a6662050186b164f272741cd67/>PikWizard</a>
</span>
</span>
<span class="image-link">
<span
style="margin: 0 0 20px 0; display: inline-block; vertical-align: middle; width: 100%;"
>
<a
target="_blank"
href="https://pikwizard.com/photo/tablet-displaying-bitcoin-candlestick-chart-on-blue-background/8b02d5a6662050186b164f272741cd67/"
style="text-decoration: none; font-size: 10px; margin: 0;"
>
<img src="https://pikwizard.com/pw/medium/8b02d5a6662050186b164f272741cd67.jpg" style="margin: 0; width: 100%;" alt="" />
<p style="font-size: 12px; margin: 0;">PikWizard</p>
</a>
</span>
</span>
Free (free of charge)
Free for personal and commercial use.
Author: AI Creator
Similar Free Stock Images

Premium


Premium


Premium


Premium


Premium


Premium


Premium


Premium


Premium


Premium


Premium


Premium


Premium


Premium


Premium


Premium


Premium


Premium


Premium


Premium


Premium


Premium


Premium


Premium

