
- Home >
- Stock Photos >
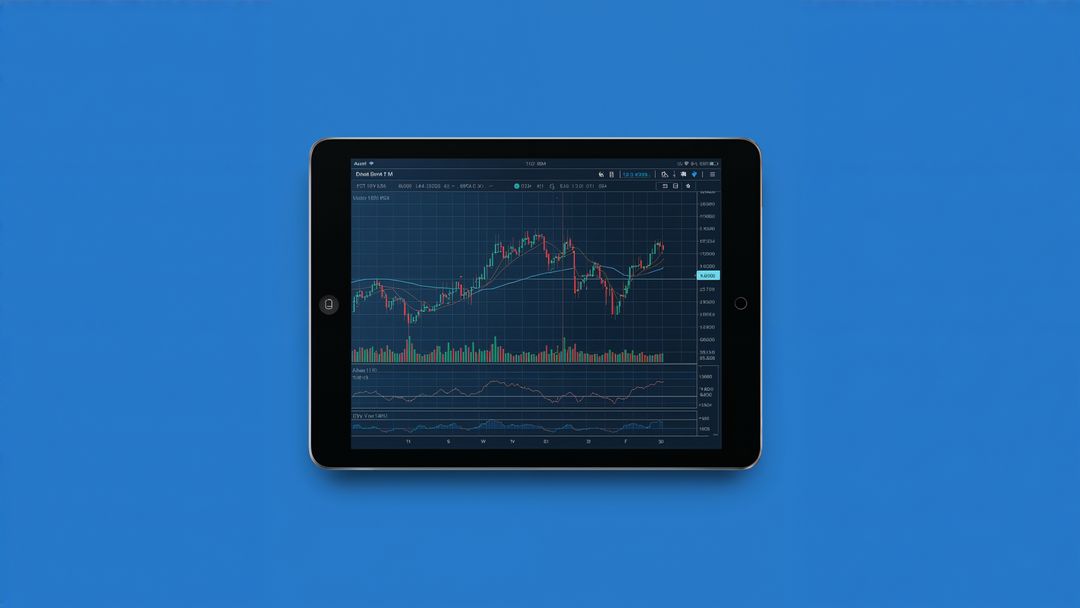
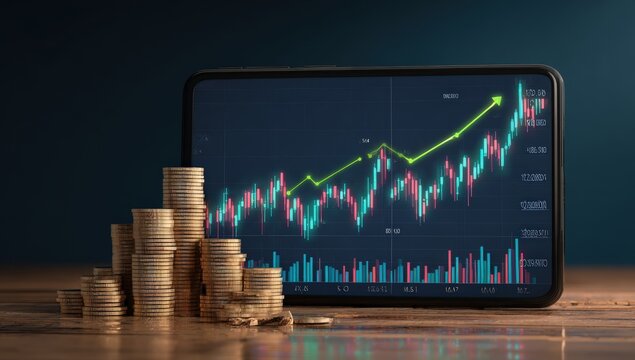
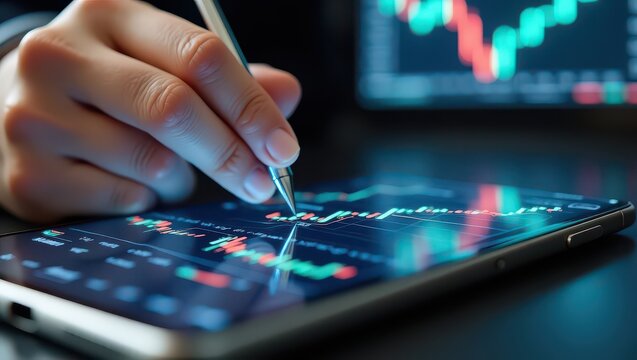
- Tablet Displaying Financial Chart on Bright Blue Background
Tablet Displaying Financial Chart on Bright Blue Background Image
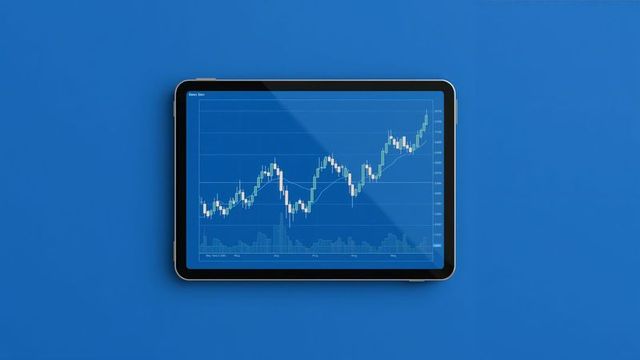
AI Generated Image. Tablet showcasing detailed candlestick and line chart accompanied by a volume bar graph on bright blue backdrop. Useful for finance or stock market presentations, technology blogs, and analyses focusing on trading data and digital visualization trends.
Powered by 


0
downloads
downloads
Tags:
More
Credit Photo
If you would like to credit the Photo, here are some ways you can do so
Text Link
photo Link
<span class="text-link">
<span>
<a target="_blank" href=https://pikwizard.com/photo/tablet-displaying-financial-chart-on-bright-blue-background/af7f30dd60d6db799e3f1f6fad18d944/>PikWizard</a>
</span>
</span>
<span class="image-link">
<span
style="margin: 0 0 20px 0; display: inline-block; vertical-align: middle; width: 100%;"
>
<a
target="_blank"
href="https://pikwizard.com/photo/tablet-displaying-financial-chart-on-bright-blue-background/af7f30dd60d6db799e3f1f6fad18d944/"
style="text-decoration: none; font-size: 10px; margin: 0;"
>
<img src="https://pikwizard.com/pw/medium/af7f30dd60d6db799e3f1f6fad18d944.jpg" style="margin: 0; width: 100%;" alt="" />
<p style="font-size: 12px; margin: 0;">PikWizard</p>
</a>
</span>
</span>
Free (free of charge)
Free for personal and commercial use.
Author: AI Creator
Similar Free Stock Images

Premium


Premium


Premium


Premium
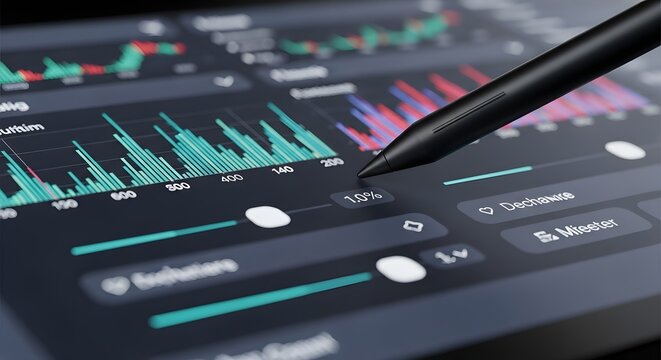
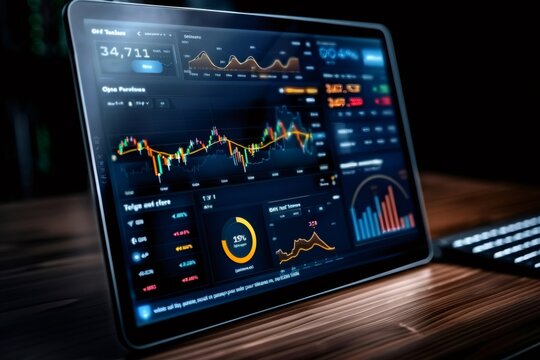
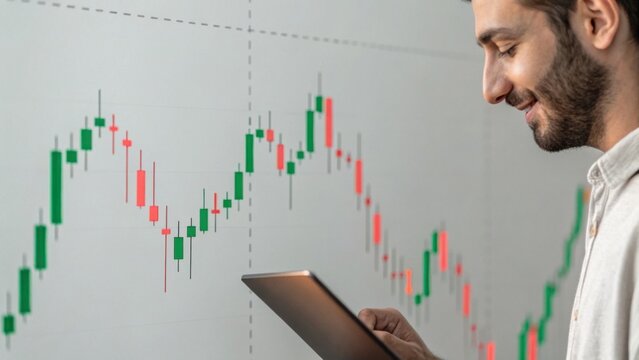
![[The tablet displaying colorful financial candlestick charts and market data in soft bokeh]](https://t4.ftcdn.net/jpg/16/69/72/09/360_F_1669720911_0WX7fuSNVdvc3W4FHVnAjOhcruAw0KWz.jpg)


Premium


Premium


Premium


Premium


Premium


Premium


Premium


Premium


Premium


Premium


Premium


Premium


Premium


Premium


Premium


Premium


Premium


Premium


Premium


Premium

