- Home >
- Stock Photos >
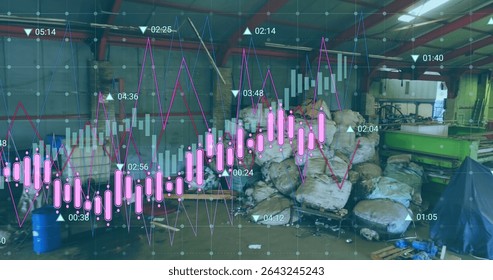
- Teal Financial Graph Overlaying Industrial Warehouse Roof Structure Showing Data Flow
Teal Financial Graph Overlaying Industrial Warehouse Roof Structure Showing Data Flow Image

Showcasing pitched roof with exposed steel trusses and ridge beam, glowing teal financial line chart overlaying structural grid and creating tech-meets-industry contrast. Featuring dynamic upward and downward spikes with faint numeric labels, providing sense of movement and real-time data flow. Offering strong diagonal lines and ample negative space across ceiling panels, providing room for headlines, logos, or data overlays. Visual palette pairing cool teal highlights with neutral gray steel, conveying modern analytical mood and industrial solidity. Ideal for website hero banners, fintech or investment presentation backgrounds, annual report covers, editorial about smart warehouses or industrial IoT, marketing for analytics platforms, and social media ad campaigns. Editing tips include increasing contrast and glow on teal graph for high-impact headers, cropping to panoramic ratio for web banners, desaturating background to emphasize data overlay, and adding brand colors or copy in upper left or lower right voids.
Powered by  - Get 15% off with code: PIKWIZARD15


0
downloads
downloads
Tags:
More
Credit Photo
If you would like to credit the Photo, here are some ways you can do so
Text Link
photo Link
<span class="text-link">
<span>
<a target="_blank" href=https://pikwizard.com/photo/teal-financial-graph-overlaying-industrial-warehouse-roof-structure-showing-data-flow/166f53f2592b643bcb0f351f78de8ac3/>PikWizard</a>
</span>
</span>
<span class="image-link">
<span
style="margin: 0 0 20px 0; display: inline-block; vertical-align: middle; width: 100%;"
>
<a
target="_blank"
href="https://pikwizard.com/photo/teal-financial-graph-overlaying-industrial-warehouse-roof-structure-showing-data-flow/166f53f2592b643bcb0f351f78de8ac3/"
style="text-decoration: none; font-size: 10px; margin: 0;"
>
<img src="https://pikwizard.com/pw/medium/166f53f2592b643bcb0f351f78de8ac3.jpg" style="margin: 0; width: 100%;" alt="" />
<p style="font-size: 12px; margin: 0;">PikWizard</p>
</a>
</span>
</span>
Free (free of charge)
Free for personal and commercial use.
Author: People Creations
Similar Free Stock Images