- Home >
- Stock Photos >
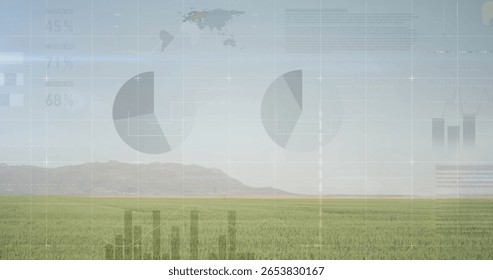
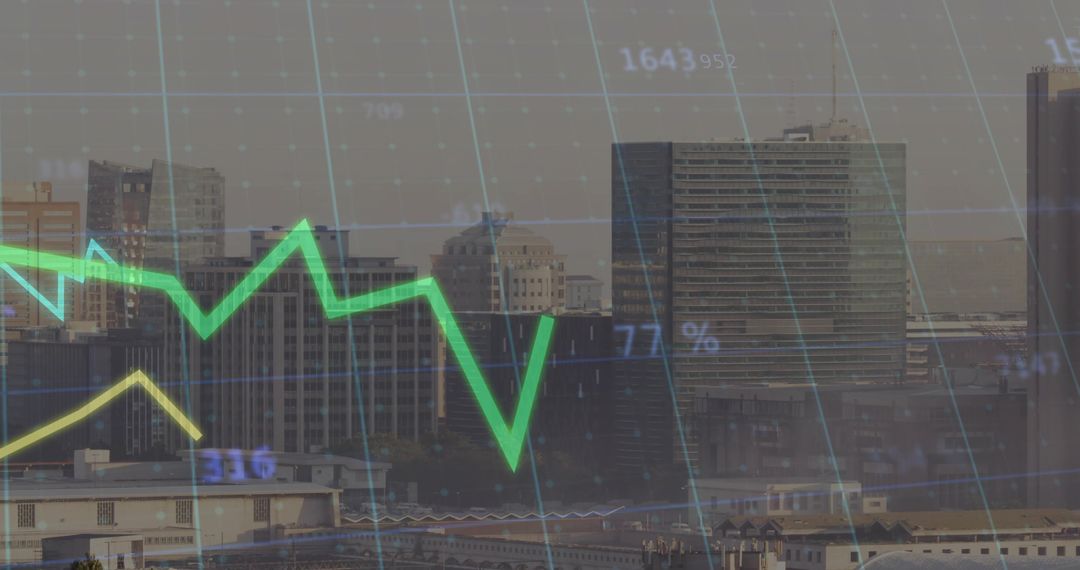
- Translucent Green 3D Bar Chart Showing Polyline Trend over Agricultural Grass Texture
Translucent Green 3D Bar Chart Showing Polyline Trend over Agricultural Grass Texture Image
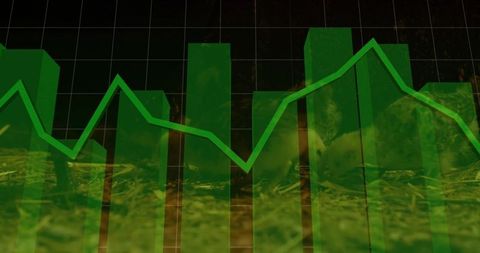
Presenting translucent green 3D bars with bright polyline overlay and grass texture on dark grid, conveying agriculture-focused data trends. Serving as visual metaphor for agritech analytics, commodity price movements, farm productivity tracking, and sustainability reporting. Working well for business presentations, website hero graphics, slide decks, blog headers, social media posts, and marketing collateral. Allowing easy addition of logos, numeric callouts, and annotations for custom dashboards. Supporting high-contrast text overlays and color adjustments for brand alignment.
Powered by  - Get 15% off with code: PIKWIZARD15


0
downloads
downloads
Tags:
More
Credit Photo
If you would like to credit the Photo, here are some ways you can do so
Text Link
photo Link
<span class="text-link">
<span>
<a target="_blank" href=https://pikwizard.com/photo/translucent-green-3d-bar-chart-showing-polyline-trend-over-agricultural-grass-texture/8b5ec1034f1310a5953c808524442761/>PikWizard</a>
</span>
</span>
<span class="image-link">
<span
style="margin: 0 0 20px 0; display: inline-block; vertical-align: middle; width: 100%;"
>
<a
target="_blank"
href="https://pikwizard.com/photo/translucent-green-3d-bar-chart-showing-polyline-trend-over-agricultural-grass-texture/8b5ec1034f1310a5953c808524442761/"
style="text-decoration: none; font-size: 10px; margin: 0;"
>
<img src="https://pikwizard.com/pw/medium/8b5ec1034f1310a5953c808524442761.jpg" style="margin: 0; width: 100%;" alt="" />
<p style="font-size: 12px; margin: 0;">PikWizard</p>
</a>
</span>
</span>
Free (free of charge)
Free for personal and commercial use.
Author: Authentic Images
Similar Free Stock Images
Premium


Premium


Premium


Premium


Premium


Premium


Premium


Premium


Premium


Premium


Premium


Premium


Premium


Premium


Premium


Premium


Premium


Premium


Premium


Premium


Premium


Premium


Premium


Premium