
- Home >
- Stock Photos >
- Transparent Overlaid Financial Charts Visualizing Market Data
Transparent Overlaid Financial Charts Visualizing Market Data Image
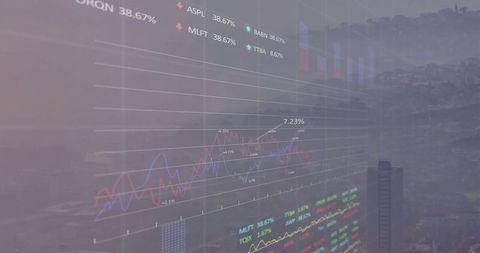
This visually compelling image shows digital financial charts and stock ticker data overlaid on a glass skyscraper wall background, suggesting a high-tech business setting. These charts, featuring fluctuating graph lines and percentage changes, provide an engaging representation of stock market analysis. Ideal for illustrating topics related to corporate finance, investment strategies, financial analysis, economic forecasting, and business technology solutions.
Powered by 


0
downloads
downloads
Tags:
More
Credit Photo
If you would like to credit the Photo, here are some ways you can do so
Text Link
photo Link
<span class="text-link">
<span>
<a target="_blank" href=https://pikwizard.com/photo/transparent-overlaid-financial-charts-visualizing-market-data/b8a7ed16c83cd330ea2217de7ff0753a/>PikWizard</a>
</span>
</span>
<span class="image-link">
<span
style="margin: 0 0 20px 0; display: inline-block; vertical-align: middle; width: 100%;"
>
<a
target="_blank"
href="https://pikwizard.com/photo/transparent-overlaid-financial-charts-visualizing-market-data/b8a7ed16c83cd330ea2217de7ff0753a/"
style="text-decoration: none; font-size: 10px; margin: 0;"
>
<img src="https://pikwizard.com/pw/medium/b8a7ed16c83cd330ea2217de7ff0753a.jpg" style="margin: 0; width: 100%;" alt="" />
<p style="font-size: 12px; margin: 0;">PikWizard</p>
</a>
</span>
</span>
Free (free of charge)
Free for personal and commercial use.
Author: People Creations