
- Home >
- Stock Photos >
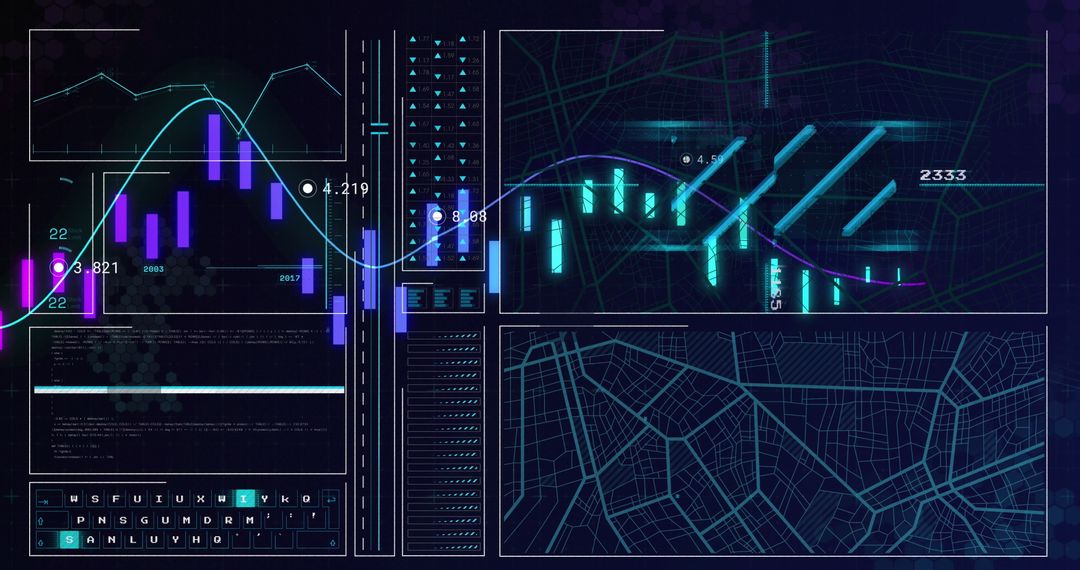
- Turquoise Candlestick Trading Chart with Cyan Moving Average and Real-Time Analytics Dashboard
Turquoise Candlestick Trading Chart with Cyan Moving Average and Real-Time Analytics Dashboard Image

High-tech trading visualization showing turquoise candlestick chart overlaying dark grid of financial panels, with cyan moving average line, numeric readouts, and minimalist neon accents. Depth-of-field and matrix of data panels creating dynamic sense of real-time market monitoring. Clean, modern aesthetic using cool blue tones and geometric elements, suiting corporate branding, fintech collateral, and editorial design. Suggested uses: - Serving as website hero banner for fintech, trading platform, brokerage - Enhancing presentation slides for market analysis, investment strategy, algorithmic trading reports - Illustrating finance articles about market trends, technical analysis, big data - Promoting social media campaigns for trading apps, data analytics tools, webinars - Providing background for dashboards, investor pitches, product demos Composition notes: strong contrast, shallow depth-of-field, repeated panels creating sense of scale. Color palette focused on cyan and navy for modern tech feel.
Powered by 


0
downloads
downloads
Tags:
More
Credit Photo
If you would like to credit the Photo, here are some ways you can do so
Text Link
photo Link
<span class="text-link">
<span>
<a target="_blank" href=https://pikwizard.com/photo/turquoise-candlestick-trading-chart-with-cyan-moving-average-and-real-time-analytics-dashboard/a9edcc3235cdcaab35046949b6f0c772/>PikWizard</a>
</span>
</span>
<span class="image-link">
<span
style="margin: 0 0 20px 0; display: inline-block; vertical-align: middle; width: 100%;"
>
<a
target="_blank"
href="https://pikwizard.com/photo/turquoise-candlestick-trading-chart-with-cyan-moving-average-and-real-time-analytics-dashboard/a9edcc3235cdcaab35046949b6f0c772/"
style="text-decoration: none; font-size: 10px; margin: 0;"
>
<img src="https://pikwizard.com/pw/medium/a9edcc3235cdcaab35046949b6f0c772.jpg" style="margin: 0; width: 100%;" alt="" />
<p style="font-size: 12px; margin: 0;">PikWizard</p>
</a>
</span>
</span>
Free (free of charge)
Free for personal and commercial use.
Author: Awesome Content
Similar Free Stock Images

Premium


Premium


Premium


Premium


Premium


Premium


Premium


Premium


Premium


Premium


Premium


Premium


Premium


Premium


Premium


Premium


Premium


Premium


Premium


Premium


Premium


Premium


Premium


Premium

