- Home >
- Stock Photos >
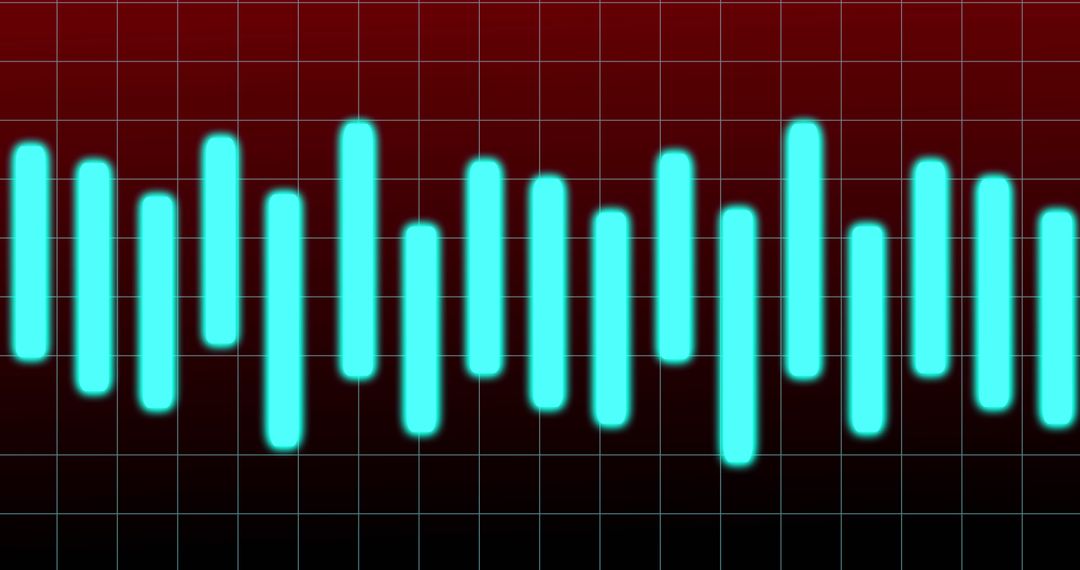
- Vibrant Digital Equalizer with Cyan Bars on Red Grid
Vibrant Digital Equalizer with Cyan Bars on Red Grid Image

Colorful illustration of cyan equalizer bars fluctuating over a red grid, accompanied by a dynamic bokeh effect. Ideal for representing music technology, electronic sound design, or digital interfaces. Perfect for backgrounds, music posters, or technological imagery in presentations.
Powered by  - Get 15% off with code: PIKWIZARD15


0
downloads
downloads
Tags:
More
Credit Photo
If you would like to credit the Photo, here are some ways you can do so
Text Link
photo Link
<span class="text-link">
<span>
<a target="_blank" href=https://pikwizard.com/photo/vibrant-digital-equalizer-with-cyan-bars-on-red-grid/d8193bc3437becbed1bc4fb91585b234/>PikWizard</a>
</span>
</span>
<span class="image-link">
<span
style="margin: 0 0 20px 0; display: inline-block; vertical-align: middle; width: 100%;"
>
<a
target="_blank"
href="https://pikwizard.com/photo/vibrant-digital-equalizer-with-cyan-bars-on-red-grid/d8193bc3437becbed1bc4fb91585b234/"
style="text-decoration: none; font-size: 10px; margin: 0;"
>
<img src="https://pikwizard.com/pw/medium/d8193bc3437becbed1bc4fb91585b234.jpg" style="margin: 0; width: 100%;" alt="" />
<p style="font-size: 12px; margin: 0;">PikWizard</p>
</a>
</span>
</span>
Free (free of charge)
Free for personal and commercial use.
Author: People Creations
Similar Free Stock Images