- Home >
- Stock Photos >
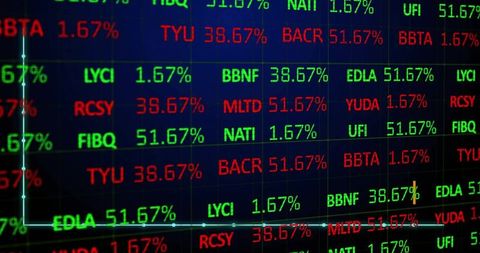
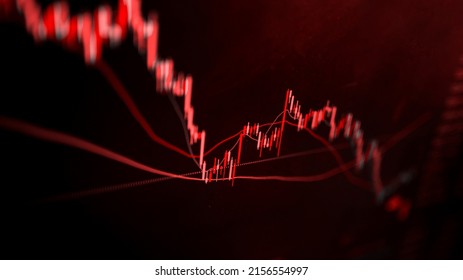
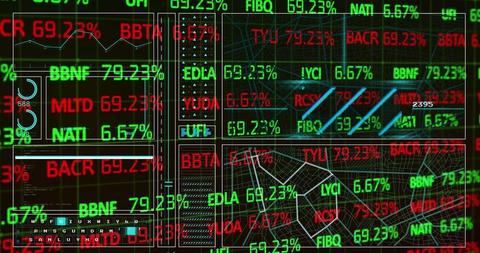
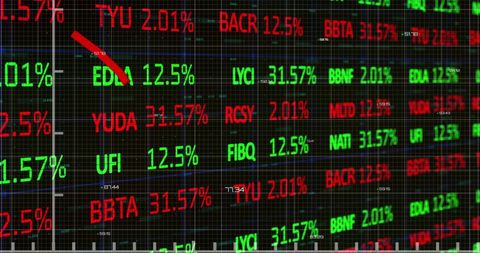
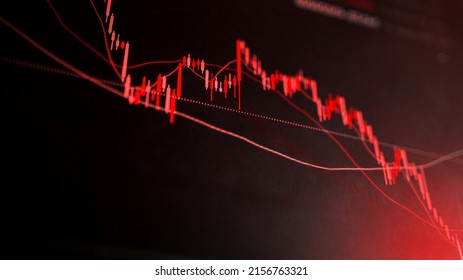
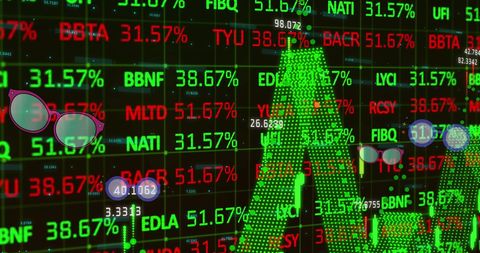
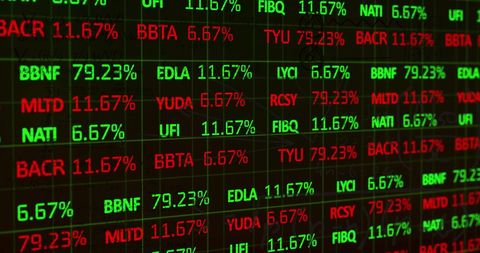
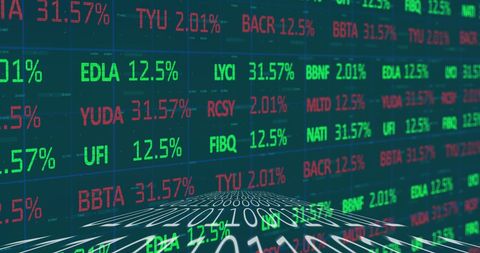
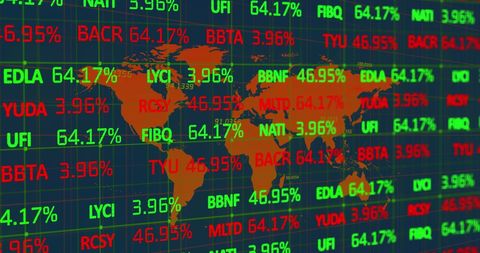
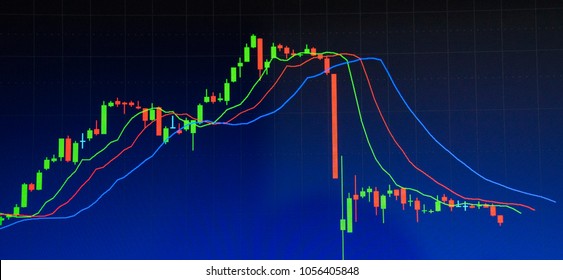
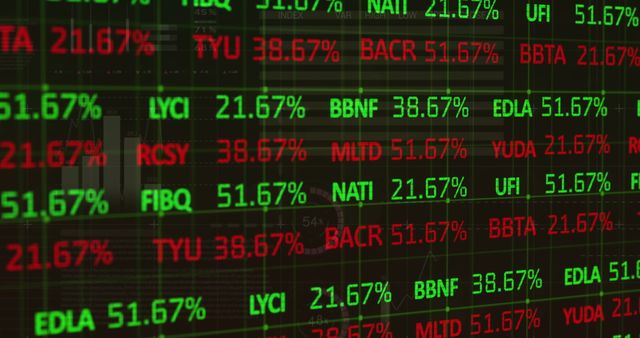
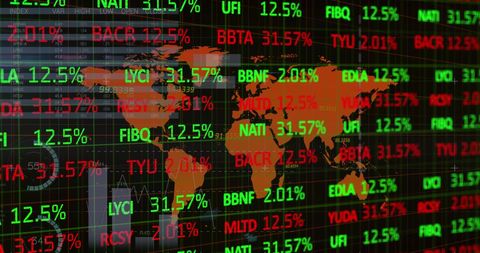
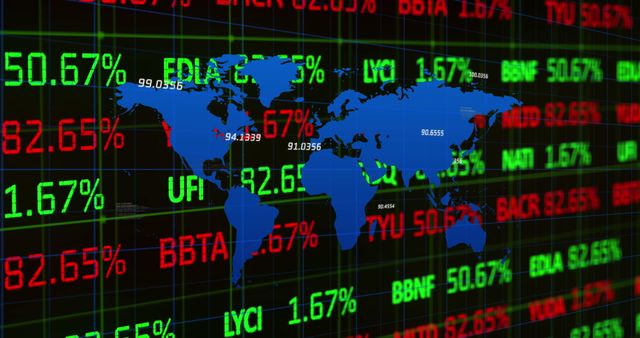
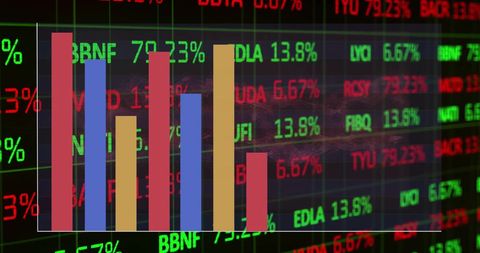
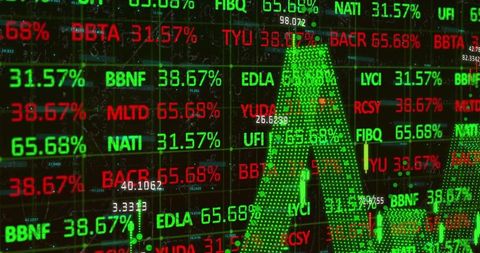
- Vibrant Stock Market Display Illustrating Trading Volatility
Vibrant Stock Market Display Illustrating Trading Volatility Image

Atmospheric representation of stock market activity with colored trading numbers and graphs, symbolizing financial market fluctuations. Ideal for illustrating articles on financial markets, investment strategy, or global economy.
Powered by  - Get 15% off with code: PIKWIZARD15


5
downloads
downloads
Tags:
More
Credit Photo
If you would like to credit the Photo, here are some ways you can do so
Text Link
photo Link
<span class="text-link">
<span>
<a target="_blank" href=https://pikwizard.com/photo/vibrant-stock-market-display-illustrating-trading-volatility/3832c9e290fb87fa9e3c7ae07e00cfcd/>PikWizard</a>
</span>
</span>
<span class="image-link">
<span
style="margin: 0 0 20px 0; display: inline-block; vertical-align: middle; width: 100%;"
>
<a
target="_blank"
href="https://pikwizard.com/photo/vibrant-stock-market-display-illustrating-trading-volatility/3832c9e290fb87fa9e3c7ae07e00cfcd/"
style="text-decoration: none; font-size: 10px; margin: 0;"
>
<img src="https://pikwizard.com/pw/medium/3832c9e290fb87fa9e3c7ae07e00cfcd.jpg" style="margin: 0; width: 100%;" alt="" />
<p style="font-size: 12px; margin: 0;">PikWizard</p>
</a>
</span>
</span>
Free (free of charge)
Free for personal and commercial use.
Author: Authentic Images
Similar Free Stock Images
Premium


Premium


Premium


Premium


Premium


Premium


Premium


Premium


Premium


Premium


Premium


Premium


Premium


Premium


Premium


Premium


Premium


Premium


Premium


Premium


Premium


Premium


Premium


Premium


Premium