- Home >
- Stock Photos >
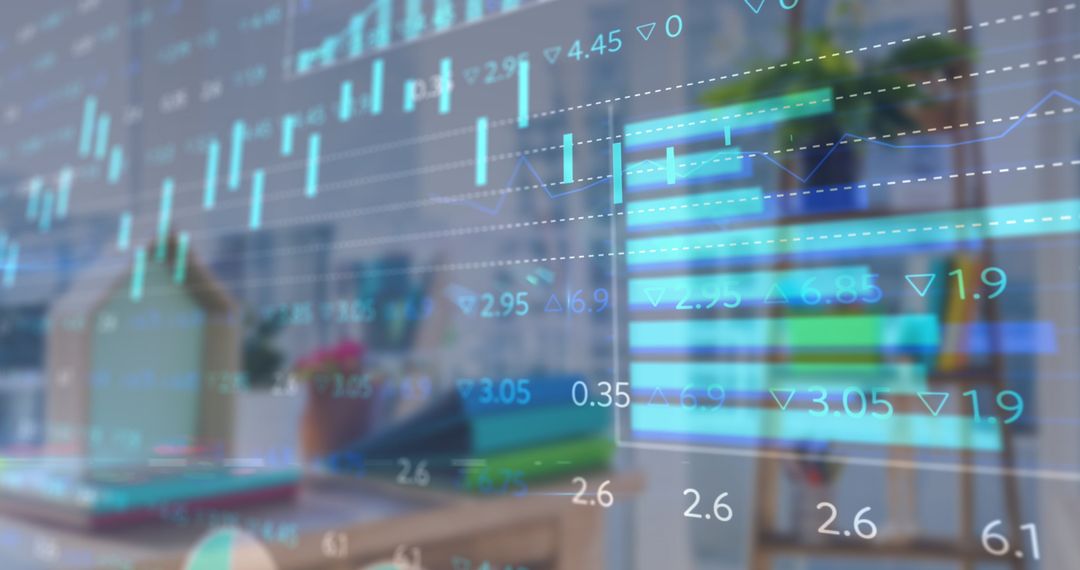
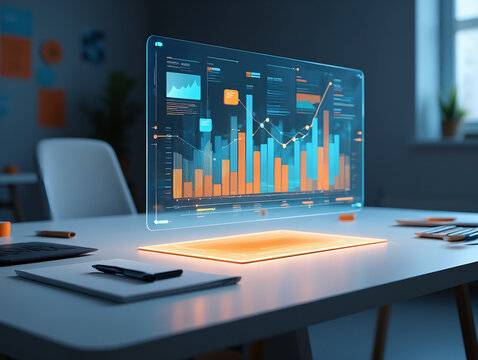
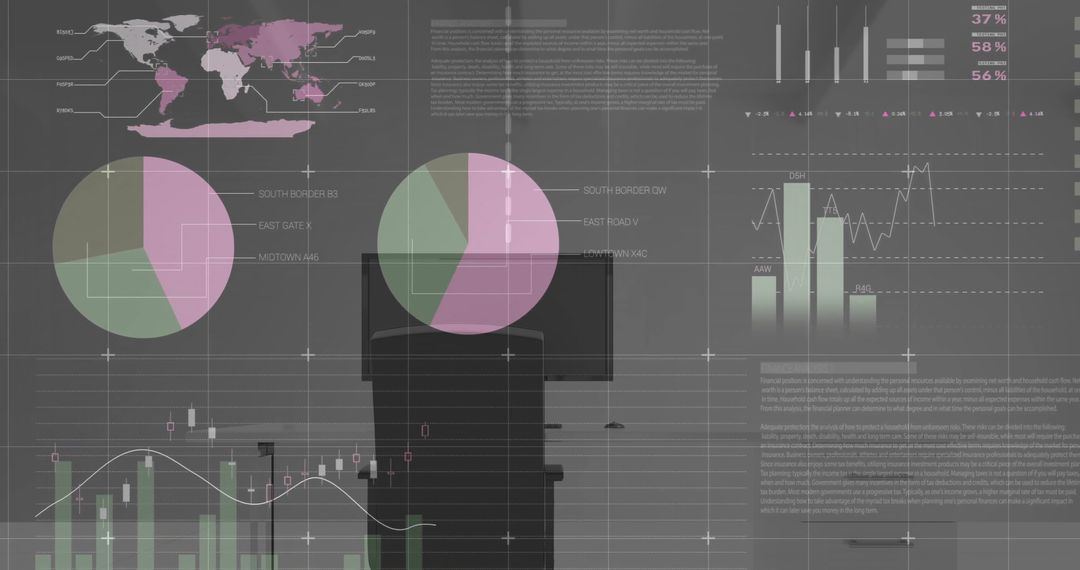
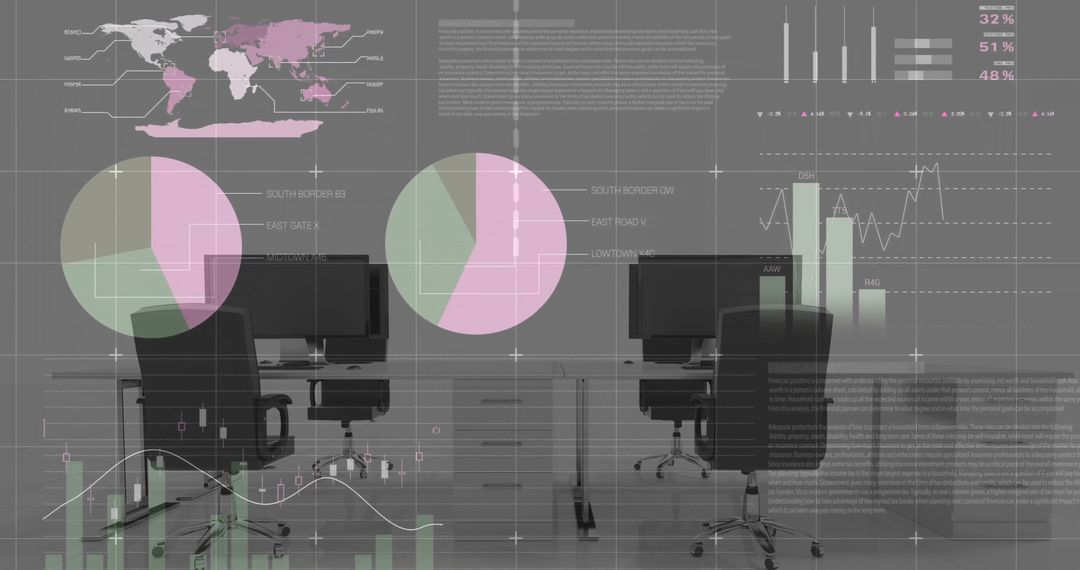
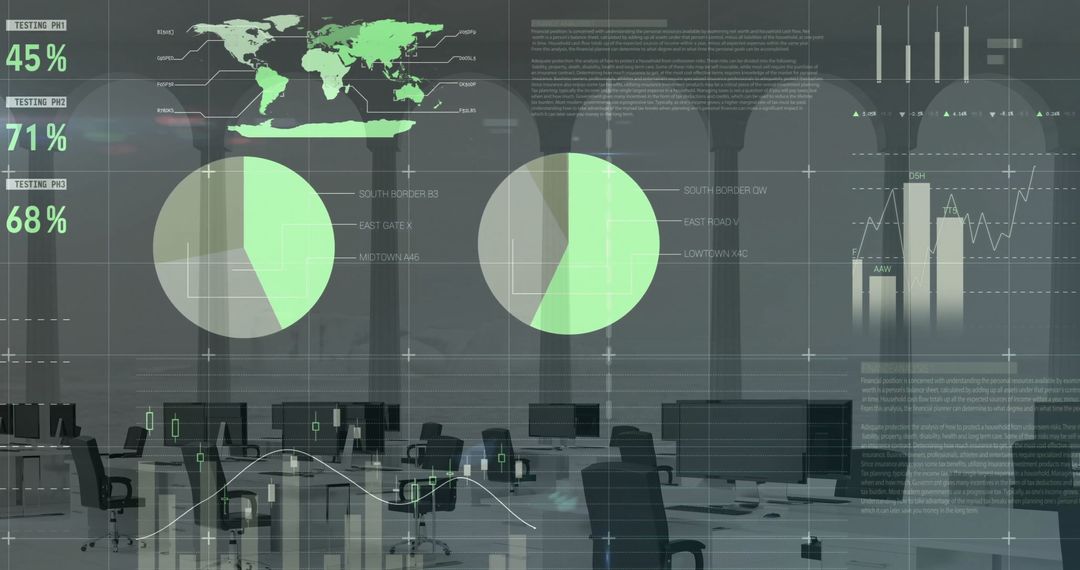
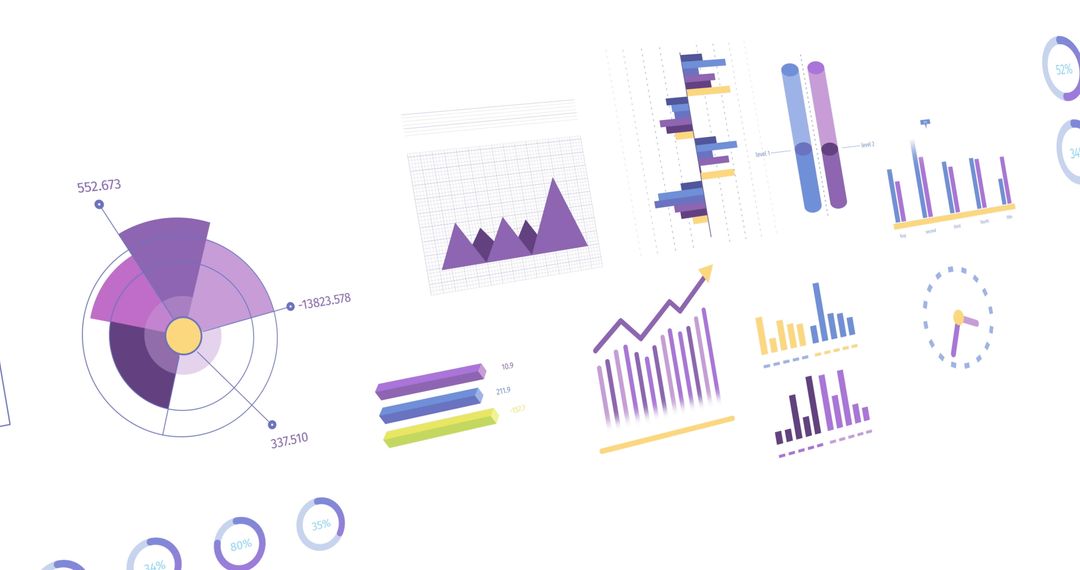
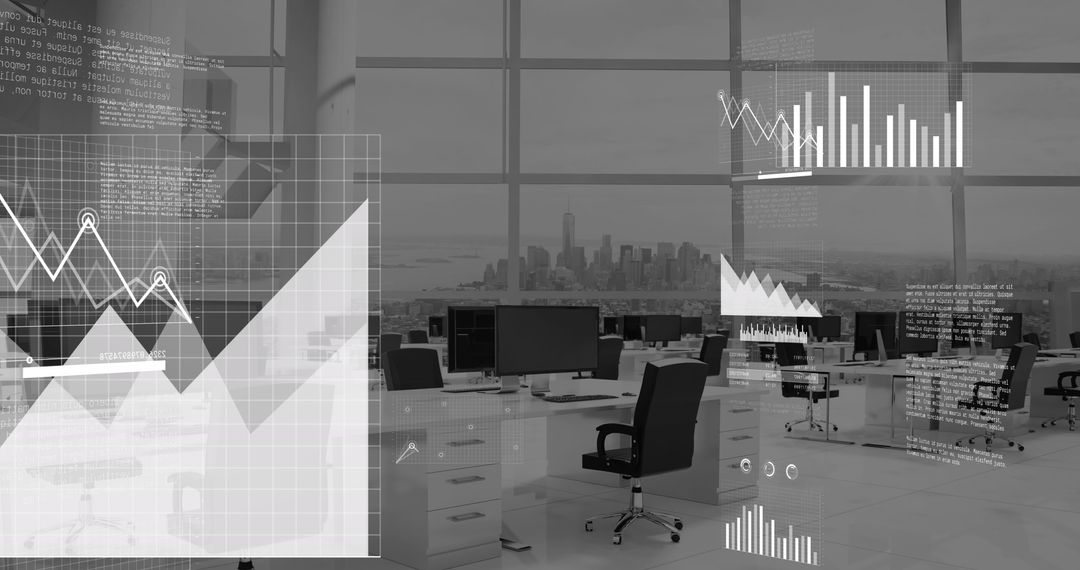
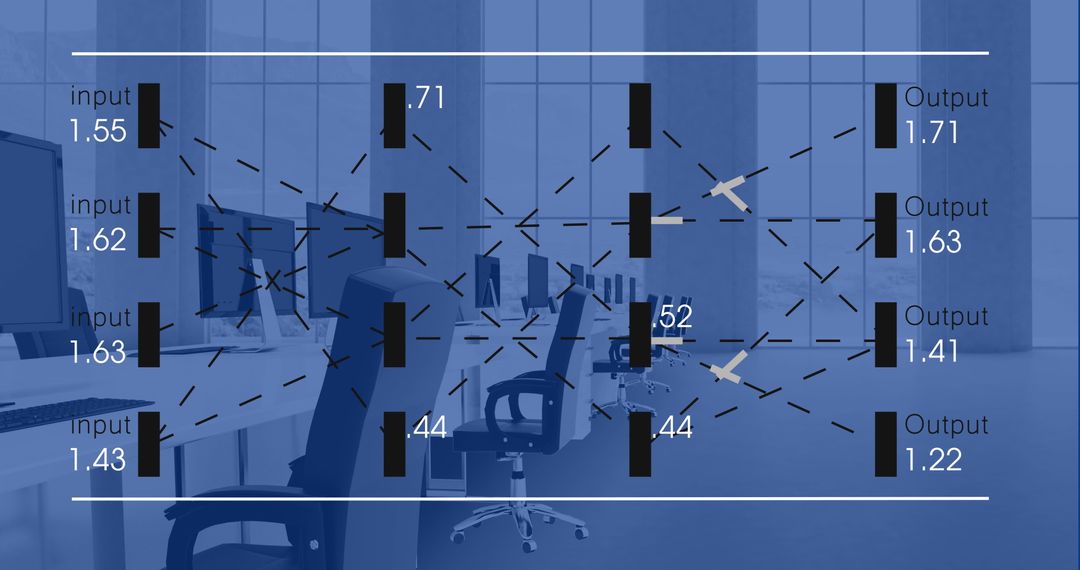
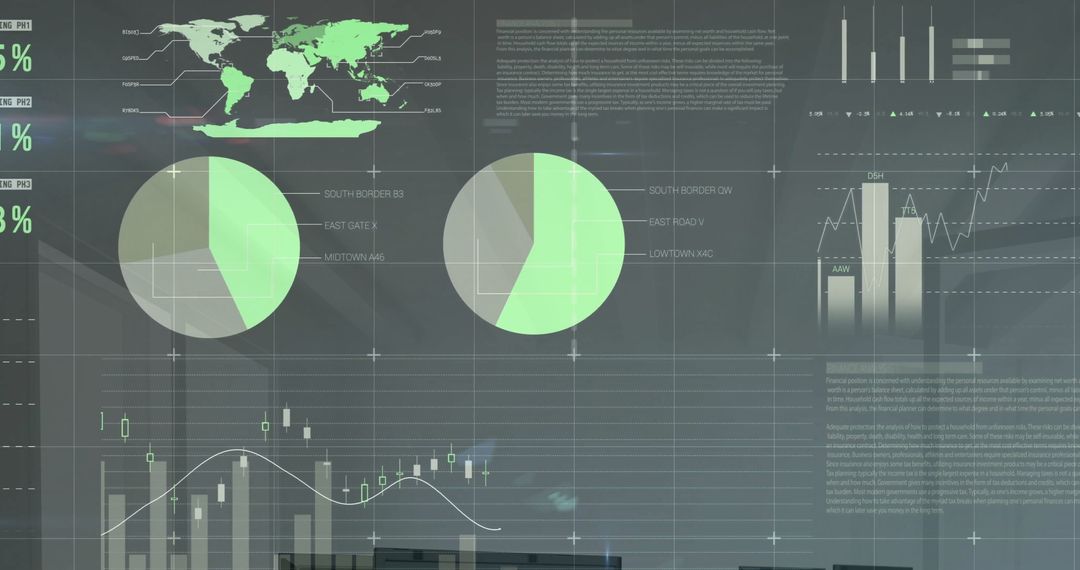
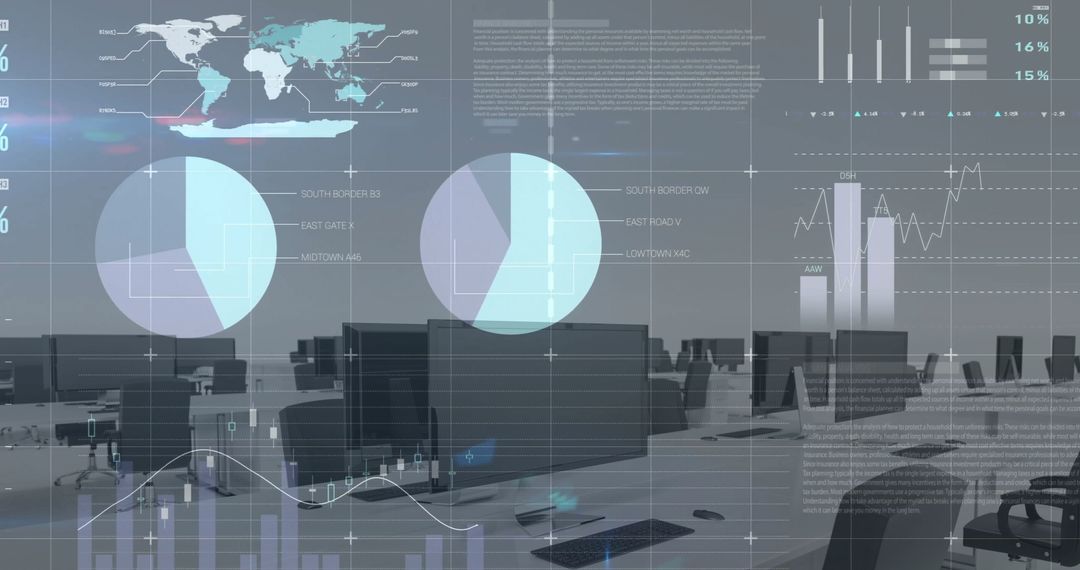
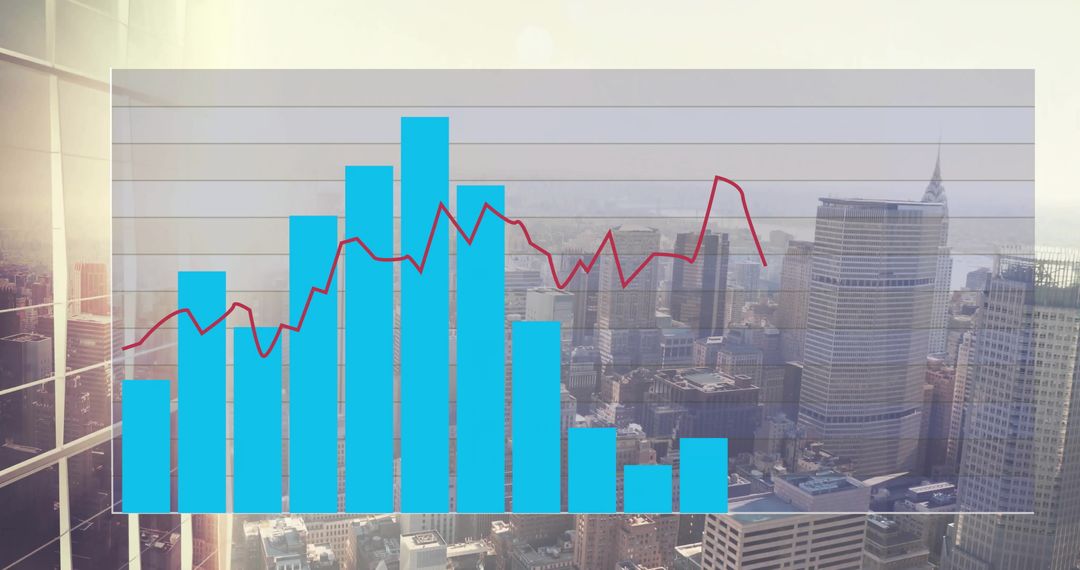
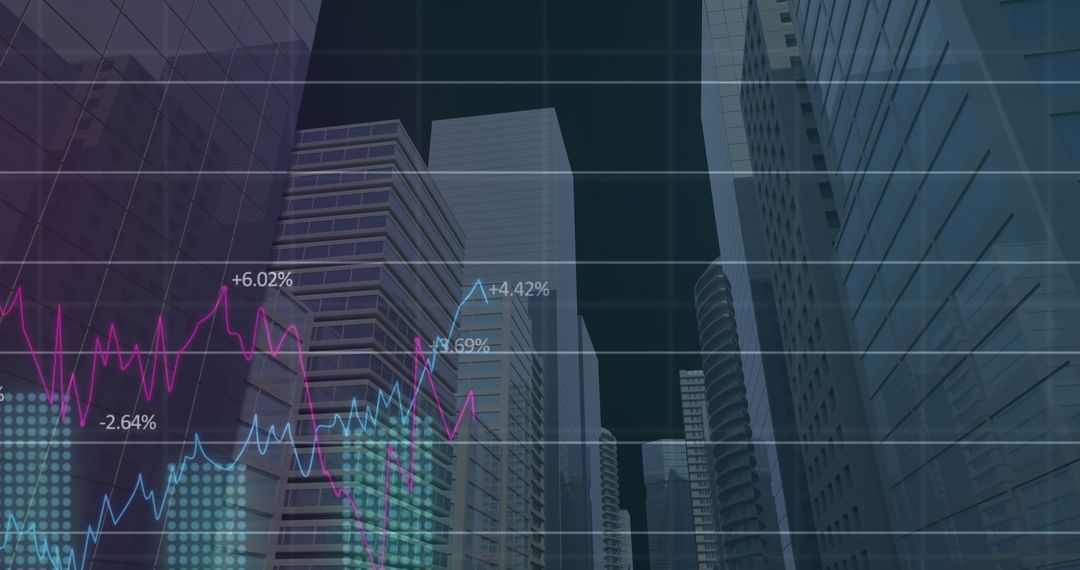
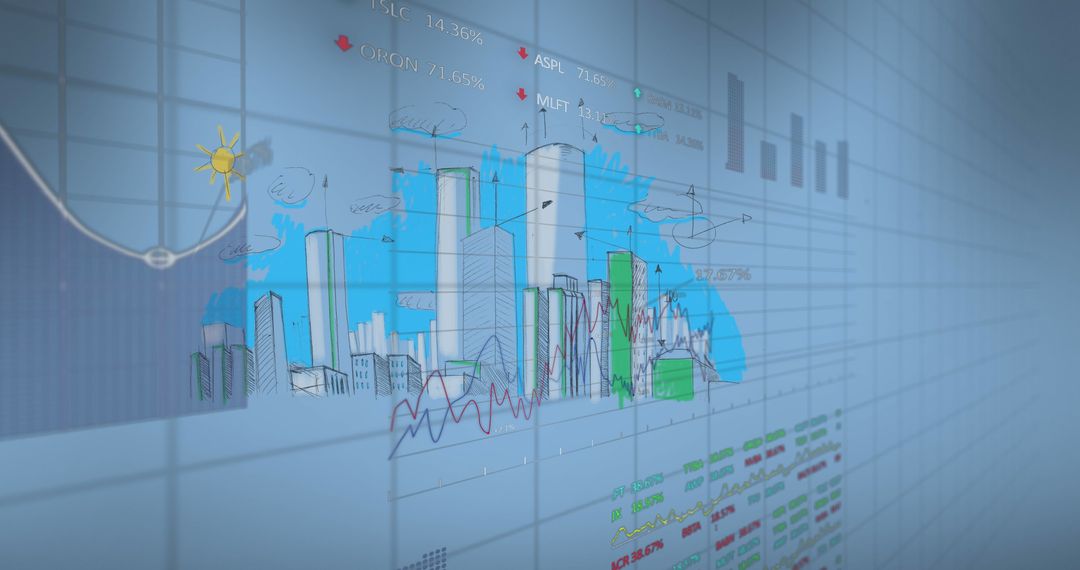
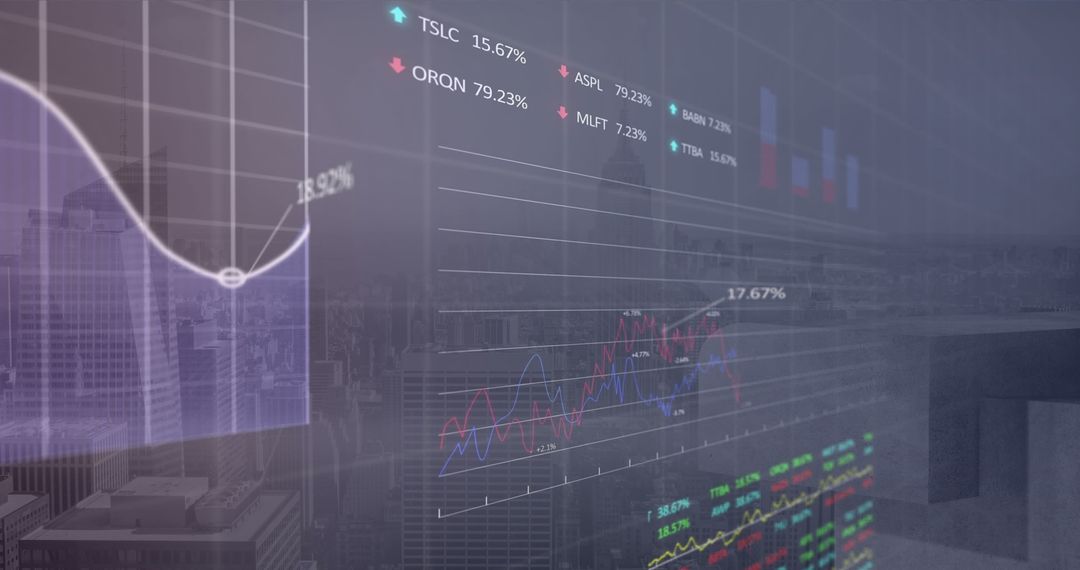
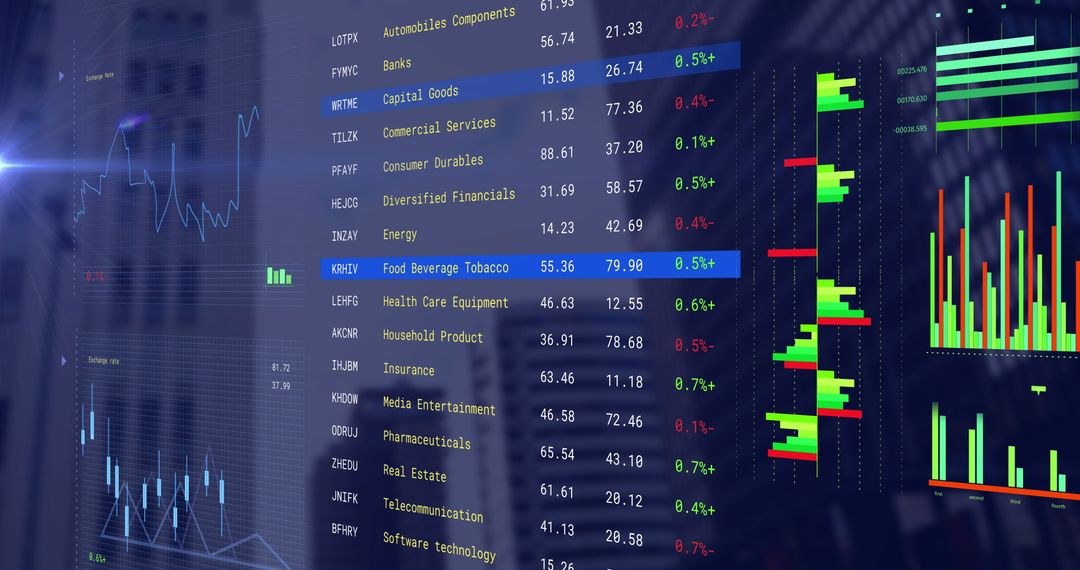
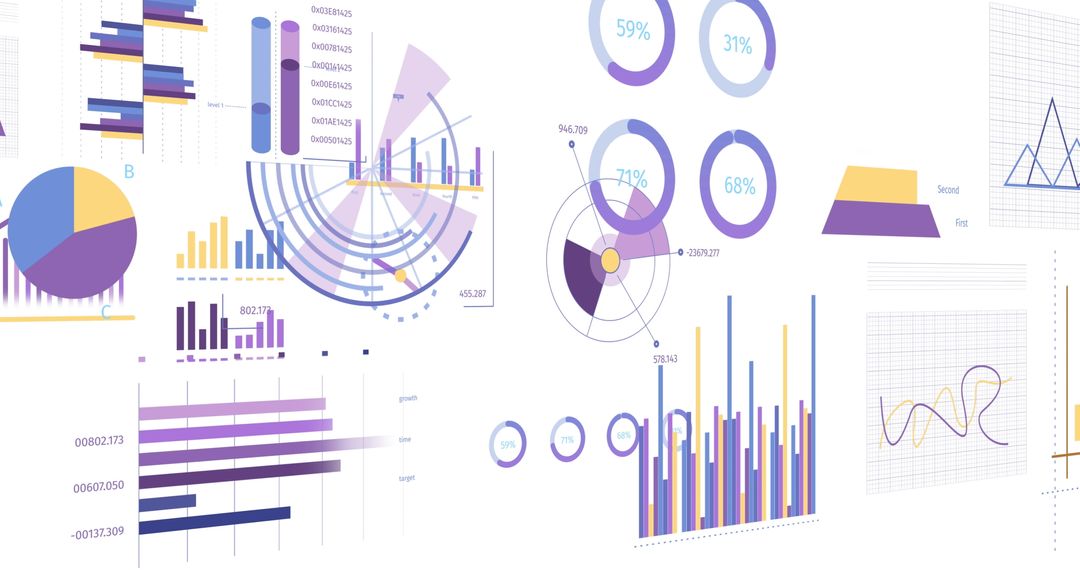
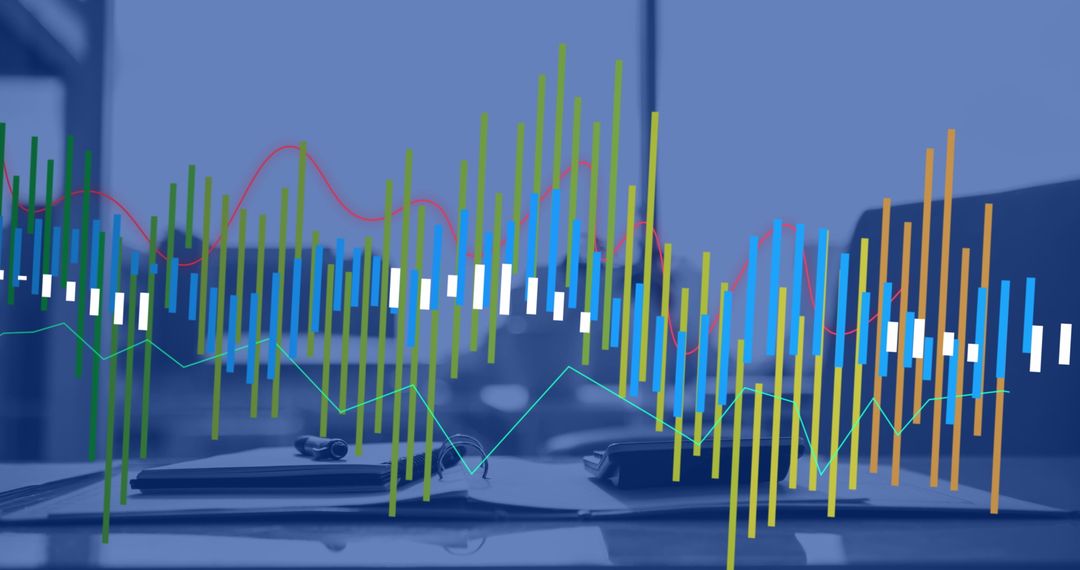
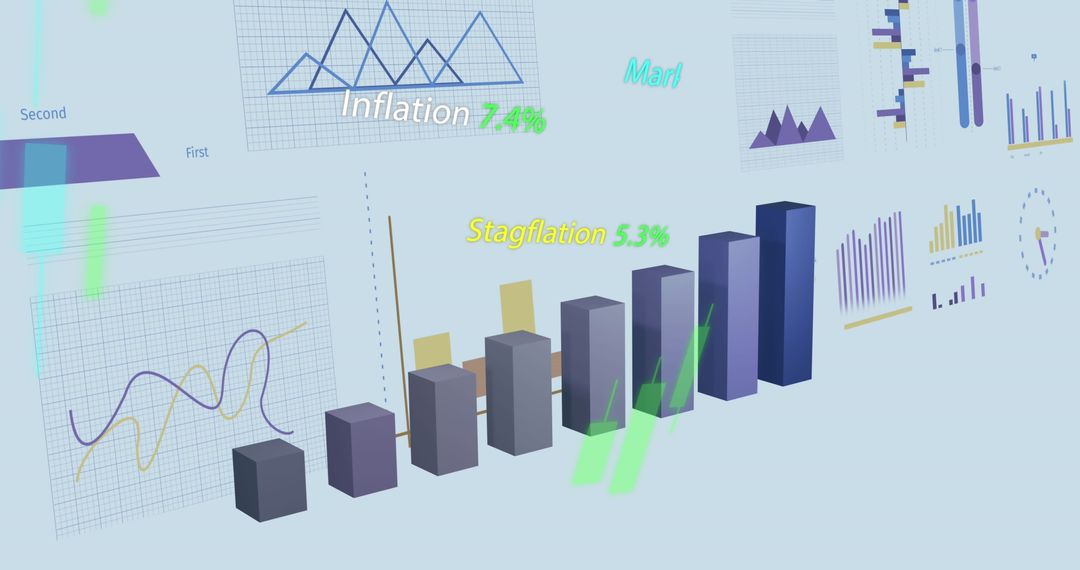
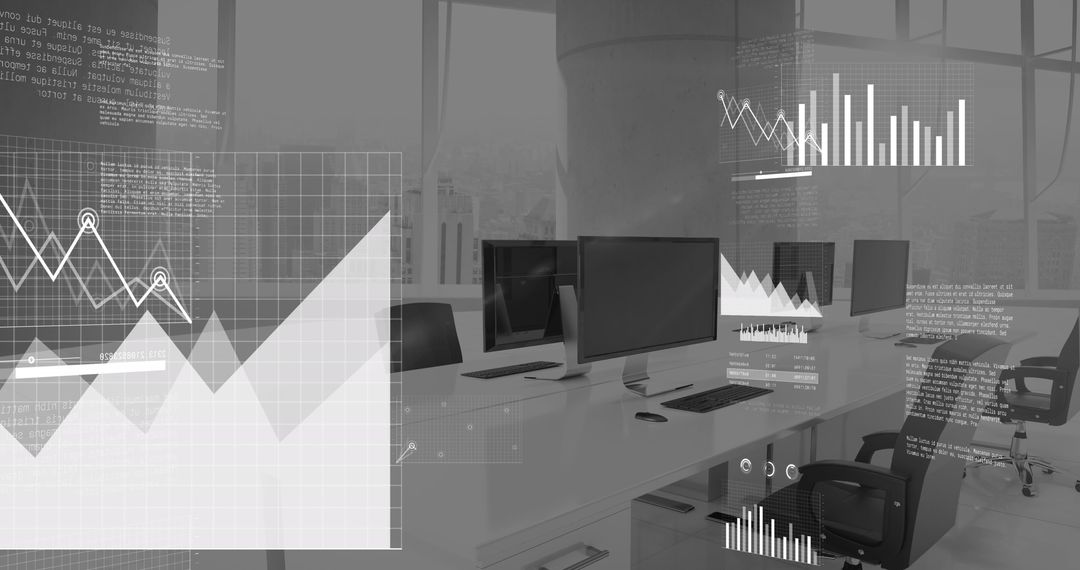
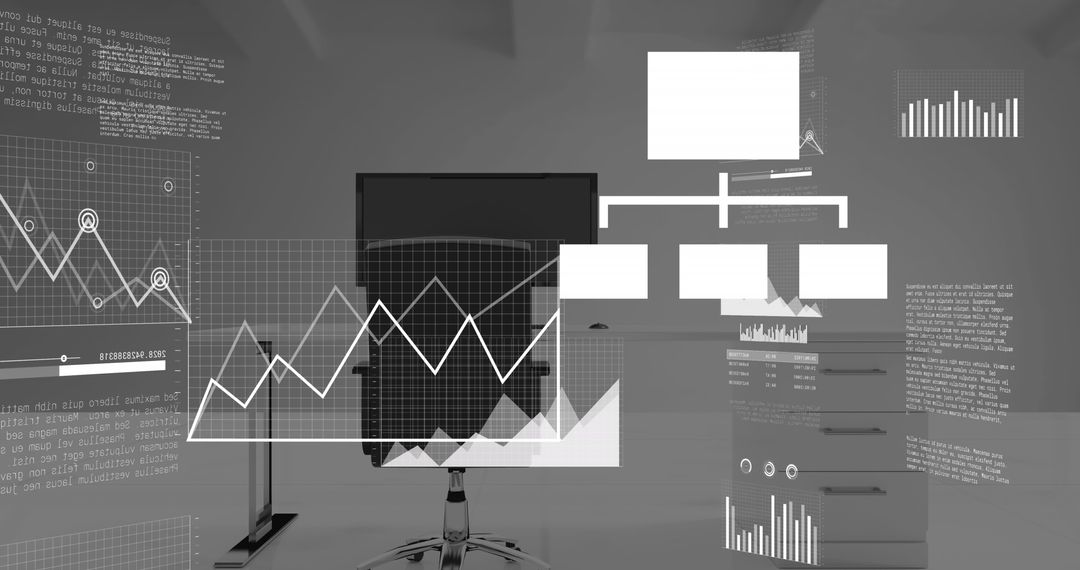
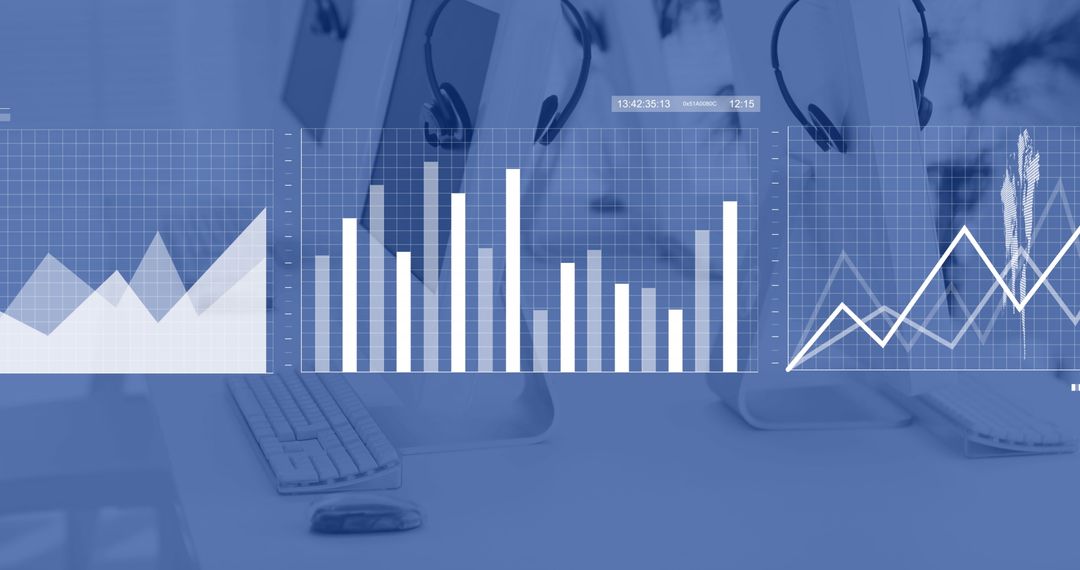
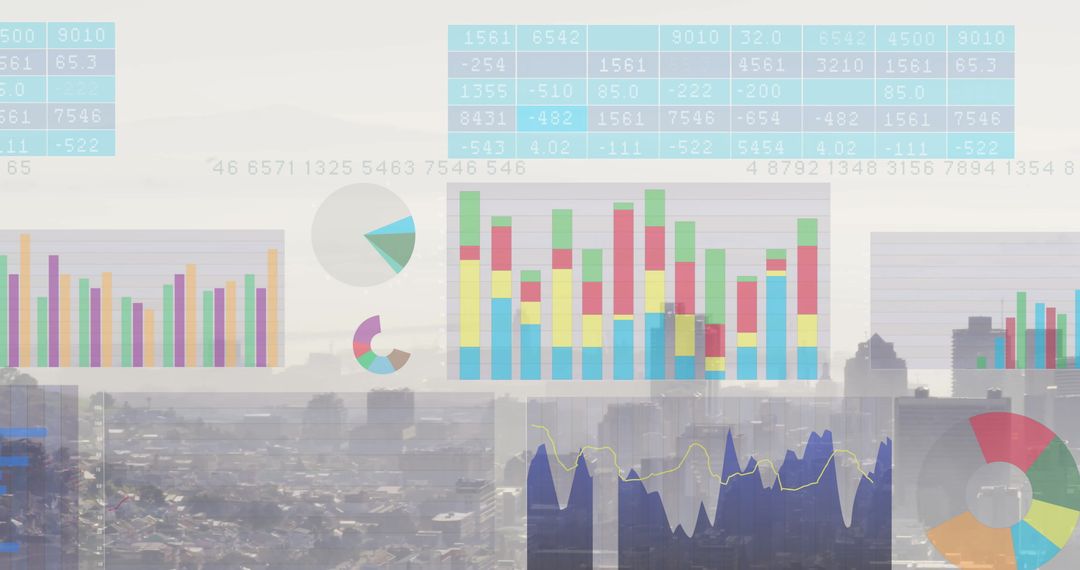
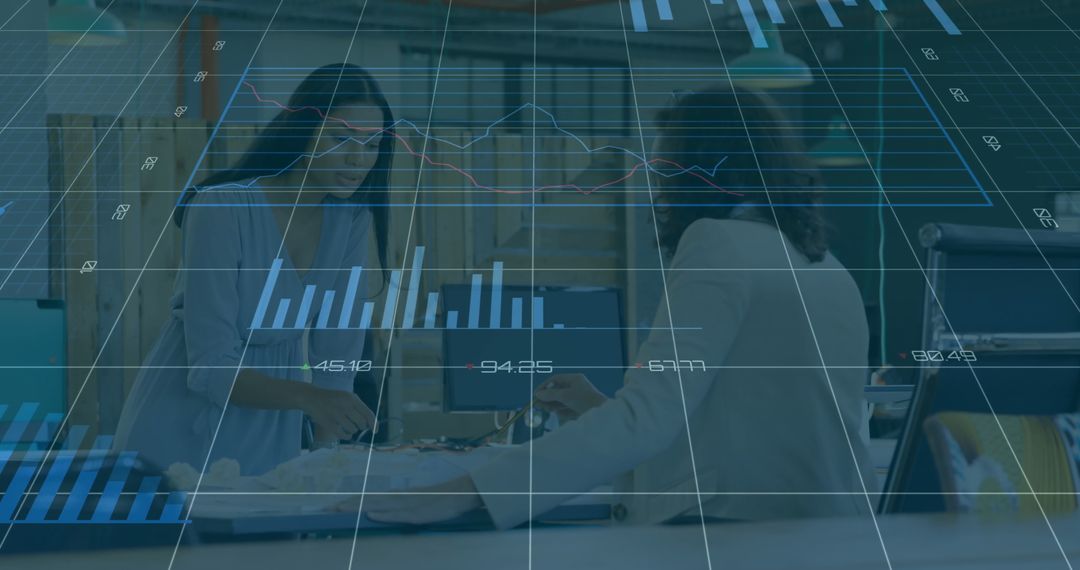
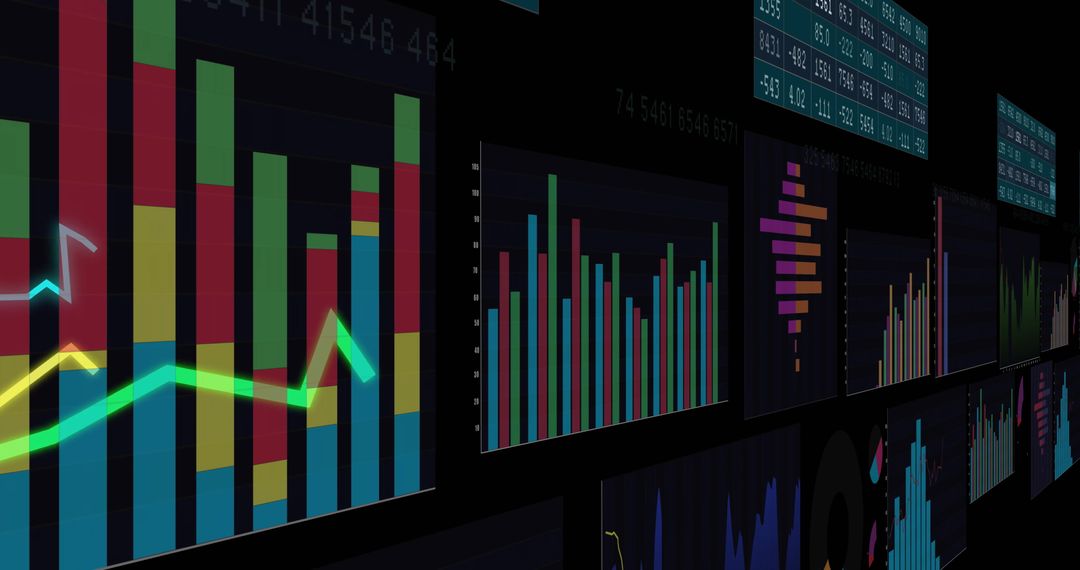
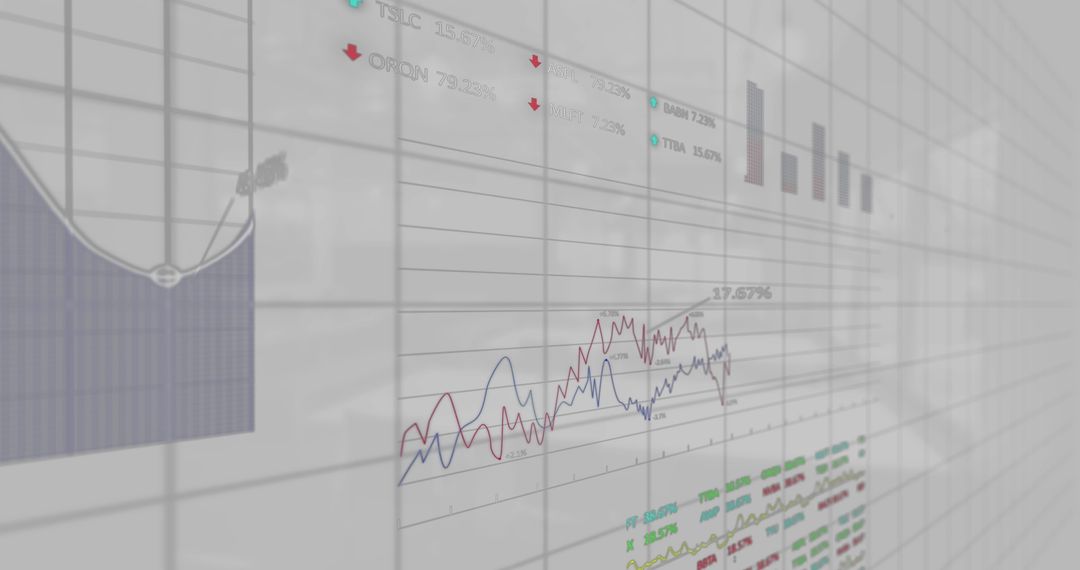
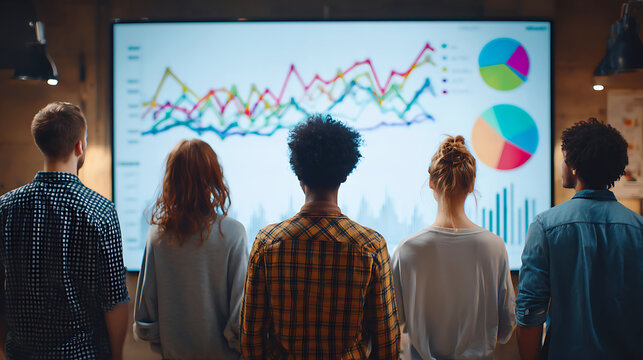
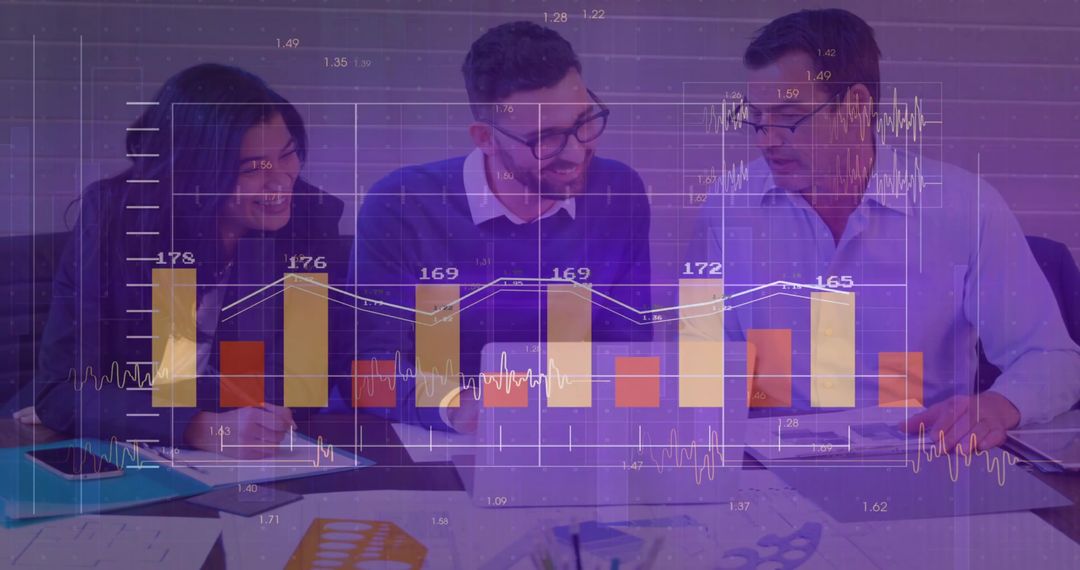
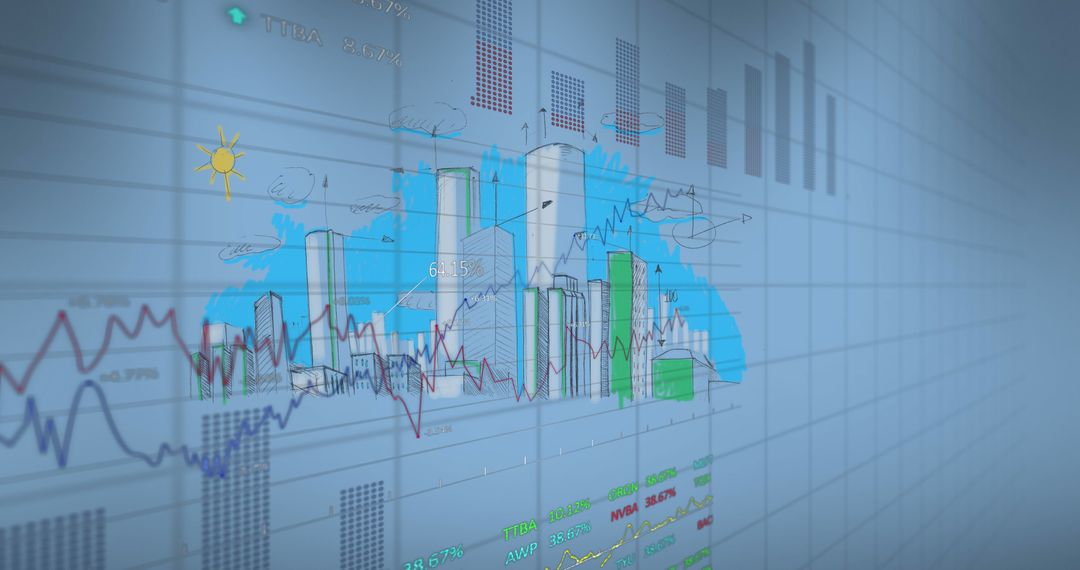
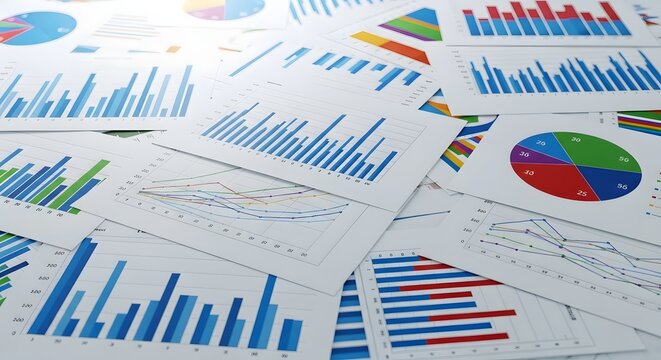
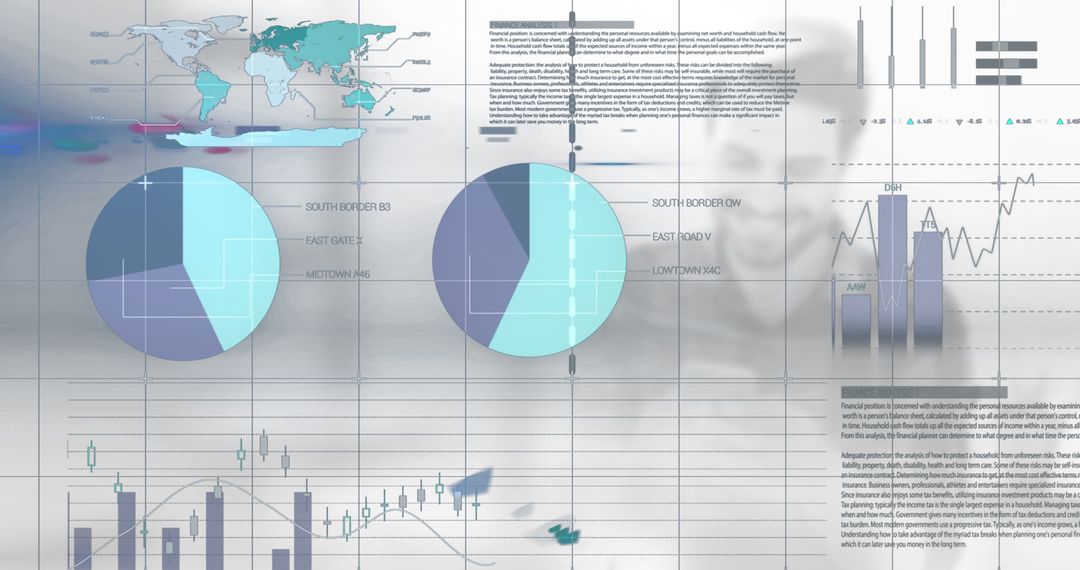
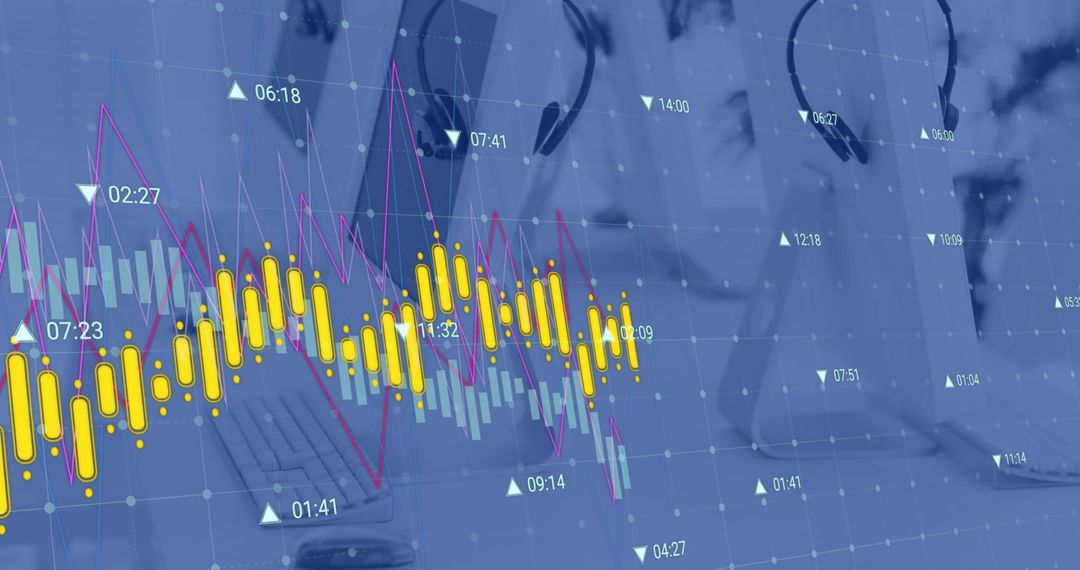
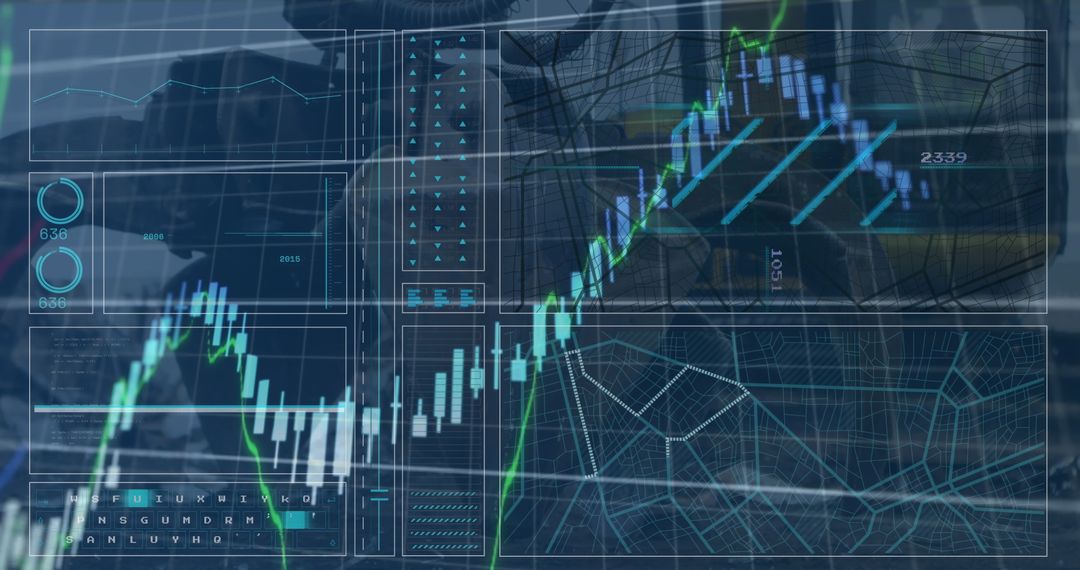
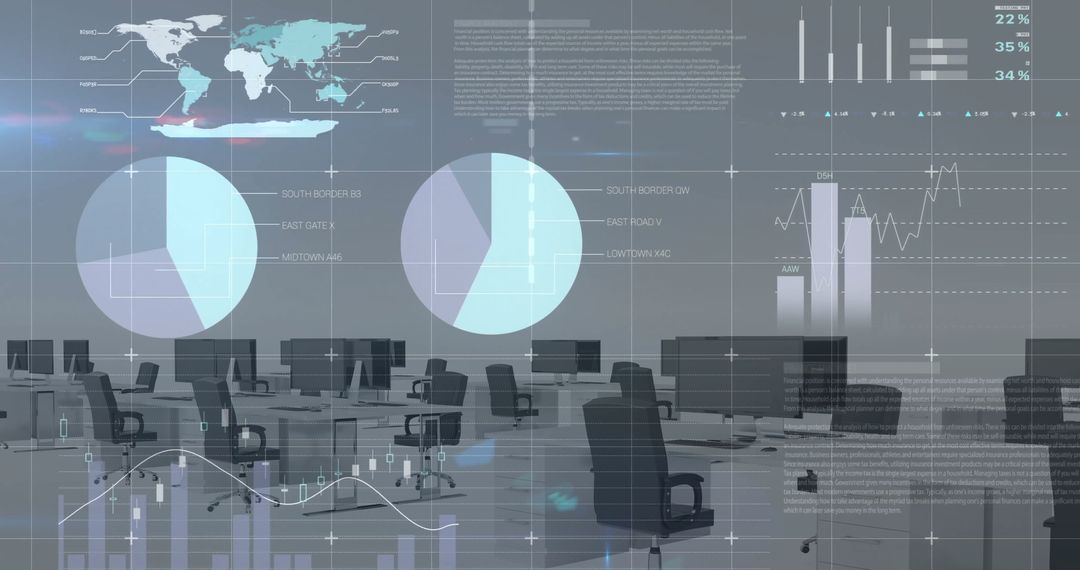
- Visualization of Financial Data Over Modern Office Desk
Visualization of Financial Data Over Modern Office Desk Image

Visual displays various financial graphs and charts floating distinctly over a computer on a desk, equipped to depict data smoothly and clearly. Commonly usable for concepts allied to financial analysis, corporate presentations, processing data effectively, or marketing materials linked with technology in business.
Powered by 


0
downloads
downloads
Tags:
More
Credit Photo
If you would like to credit the Photo, here are some ways you can do so
Text Link
photo Link
<span class="text-link">
<span>
<a target="_blank" href=https://pikwizard.com/photo/visualization-of-financial-data-over-modern-office-desk/8749ea479843d665c9258dc50a3fc13c/>PikWizard</a>
</span>
</span>
<span class="image-link">
<span
style="margin: 0 0 20px 0; display: inline-block; vertical-align: middle; width: 100%;"
>
<a
target="_blank"
href="https://pikwizard.com/photo/visualization-of-financial-data-over-modern-office-desk/8749ea479843d665c9258dc50a3fc13c/"
style="text-decoration: none; font-size: 10px; margin: 0;"
>
<img src="https://pikwizard.com/pw/medium/8749ea479843d665c9258dc50a3fc13c.jpg" style="margin: 0; width: 100%;" alt="" />
<p style="font-size: 12px; margin: 0;">PikWizard</p>
</a>
</span>
</span>
Free (free of charge)
Free for personal and commercial use.
Author: People Creations
Similar Free Stock Images
Premium


Premium


Premium


Premium


Premium


Premium


Premium


Premium


Premium


Premium


Premium


Premium


Premium


Premium

Premium


Premium


Premium


Premium


Premium


Premium


Premium


Premium


Premium


Premium