
- Home >
- Stock Photos >
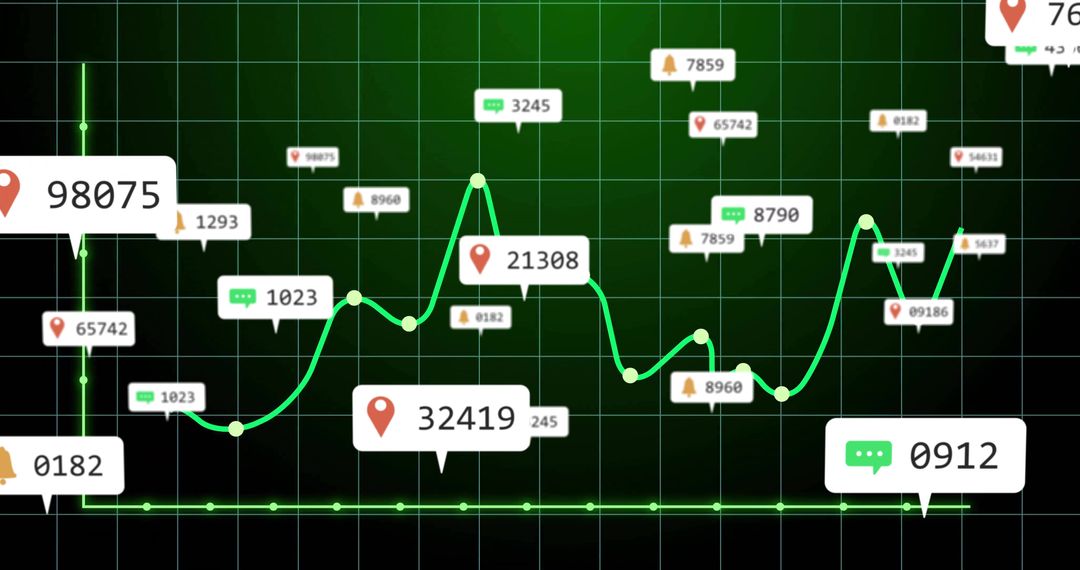
- Visualizing social media engagement with neon analytics chart and interaction callouts
Visualizing social media engagement with neon analytics chart and interaction callouts Image

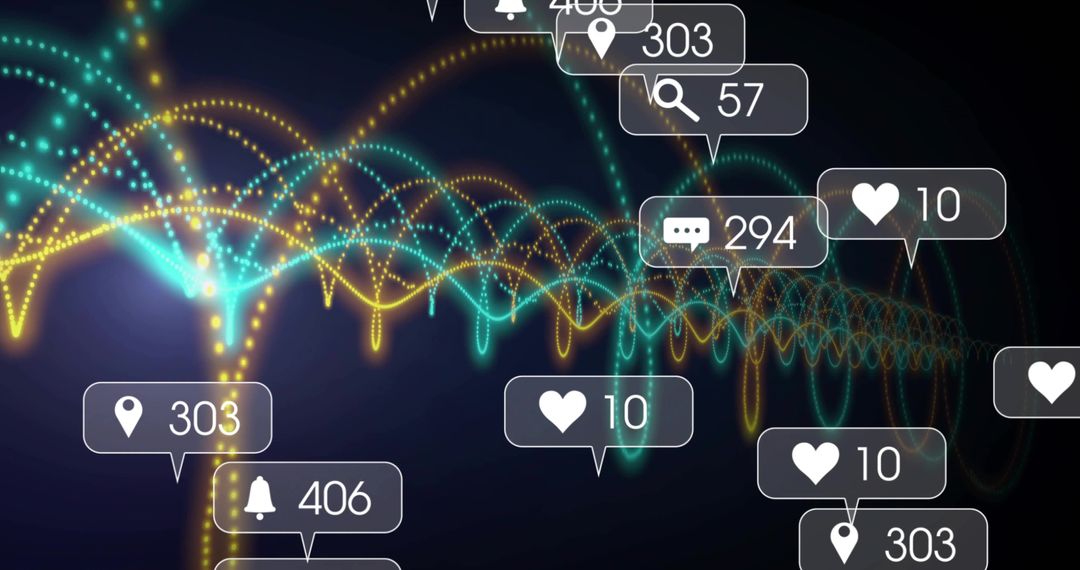
Dark purple grid displaying teal jagged line with nodes and glowing green baseline, overlaid with translucent callouts for likes, followers, shares, notifications, and play counts. High-contrast neon palette creating modern analytics dashboard look for tech and marketing projects. Suitable for website headers, presentation slides, blog posts, social media ads, marketing reports, investor decks, and data visualization mockups. Use as hero banner for digital marketing agency, background for analytics case study, or visual aid in reports about audience growth and engagement trends. Color palette and callout icons customizable by designer; nodes and baseline drawing focus to peak activity points and engagement spikes. Horizontal and vertical grid lines providing sense of scale; suitable for overlaying data labels, percentages, or KPI numbers. Ideal for marketing, social strategy, performance tracking, and UI concept presentations.
Powered by 


0
downloads
downloads
Tags:
More
Credit Photo
If you would like to credit the Photo, here are some ways you can do so
Text Link
photo Link
<span class="text-link">
<span>
<a target="_blank" href=https://pikwizard.com/photo/visualizing-social-media-engagement-with-neon-analytics-chart-and-interaction-callouts/6eb1452703b7483d5facdcb4c8ae2553/>PikWizard</a>
</span>
</span>
<span class="image-link">
<span
style="margin: 0 0 20px 0; display: inline-block; vertical-align: middle; width: 100%;"
>
<a
target="_blank"
href="https://pikwizard.com/photo/visualizing-social-media-engagement-with-neon-analytics-chart-and-interaction-callouts/6eb1452703b7483d5facdcb4c8ae2553/"
style="text-decoration: none; font-size: 10px; margin: 0;"
>
<img src="https://pikwizard.com/pw/medium/6eb1452703b7483d5facdcb4c8ae2553.jpg" style="margin: 0; width: 100%;" alt="" />
<p style="font-size: 12px; margin: 0;">PikWizard</p>
</a>
</span>
</span>
Free (free of charge)
Free for personal and commercial use.
Author: Authentic Images
Similar Free Stock Images

Premium


Premium


Premium


Premium


Premium


Premium


Premium


Premium


Premium


Premium


Premium


Premium


Premium


Premium


Premium


Premium


Premium


Premium


Premium


Premium


Premium


Premium


Premium


Premium

