- Home >
- Stock Photos >
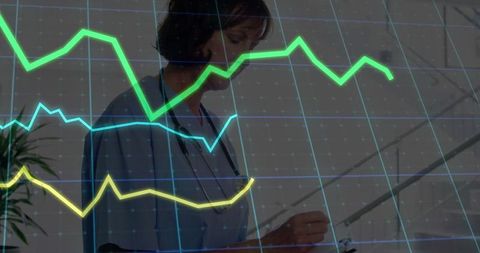
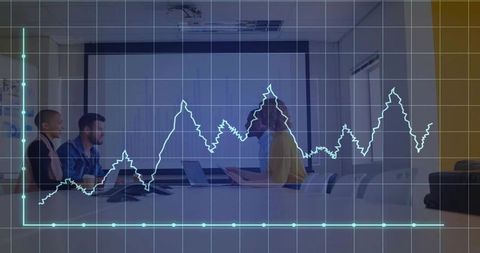
- Woman Examining Intersecting Charts with Digital Overlay
Woman Examining Intersecting Charts with Digital Overlay Image

An executive reviewing intersecting bar and line charts highlighted by a technological grid interface. Her focused expression signifies analysis and decision-making processes, enhanced by the digital environment around her. Suitable for use in contexts related to business intelligence, data driven decision making, corporate analysis, or showcasing digital productivity solutions in modern co-working spaces.
Powered by 


0
downloads
downloads
Tags:
More
Credit Photo
If you would like to credit the Photo, here are some ways you can do so
Text Link
photo Link
<span class="text-link">
<span>
<a target="_blank" href=https://pikwizard.com/photo/woman-examining-intersecting-charts-with-digital-overlay/900ea3f6e0680ab14bbdcfc9326135fd/>PikWizard</a>
</span>
</span>
<span class="image-link">
<span
style="margin: 0 0 20px 0; display: inline-block; vertical-align: middle; width: 100%;"
>
<a
target="_blank"
href="https://pikwizard.com/photo/woman-examining-intersecting-charts-with-digital-overlay/900ea3f6e0680ab14bbdcfc9326135fd/"
style="text-decoration: none; font-size: 10px; margin: 0;"
>
<img src="https://pikwizard.com/pw/medium/900ea3f6e0680ab14bbdcfc9326135fd.jpg" style="margin: 0; width: 100%;" alt="" />
<p style="font-size: 12px; margin: 0;">PikWizard</p>
</a>
</span>
</span>
Free (free of charge)
Free for personal and commercial use.
Author: Authentic Images
Similar Free Stock Images

Premium


Premium


Premium


Premium


Premium


Premium


Premium


Premium


Premium


Premium


Premium


Premium


Premium


Premium


Premium


Premium


Premium


Premium


Premium


Premium


Premium


Premium


Premium


Premium


Premium