
- Home >
- Stock Photos >
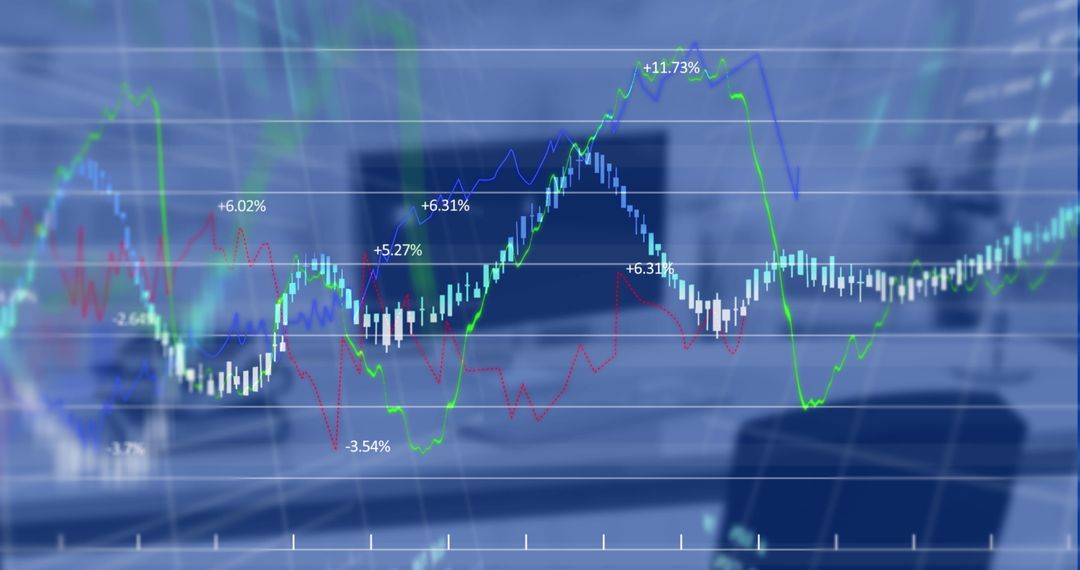
- Worker Analyzing Stock Chart in Industrial Workshop
Worker Analyzing Stock Chart in Industrial Workshop Image

Scene combines physical labor with financial analytics as worker reviews stock chart projections in an industrial setting. Useful for illustrating themes of economic trends, data analysis in construction, or productivity in manual labor environments. Applicable to industries exploring financial impact on manufacturing and trade operations.
Powered by 


0
downloads
downloads
Tags:
More
Credit Photo
If you would like to credit the Photo, here are some ways you can do so
Text Link
photo Link
<span class="text-link">
<span>
<a target="_blank" href=https://pikwizard.com/photo/worker-analyzing-stock-chart-in-industrial-workshop/0795a7c1443f368a2474e23d922b948c/>PikWizard</a>
</span>
</span>
<span class="image-link">
<span
style="margin: 0 0 20px 0; display: inline-block; vertical-align: middle; width: 100%;"
>
<a
target="_blank"
href="https://pikwizard.com/photo/worker-analyzing-stock-chart-in-industrial-workshop/0795a7c1443f368a2474e23d922b948c/"
style="text-decoration: none; font-size: 10px; margin: 0;"
>
<img src="https://pikwizard.com/pw/medium/0795a7c1443f368a2474e23d922b948c.jpg" style="margin: 0; width: 100%;" alt="" />
<p style="font-size: 12px; margin: 0;">PikWizard</p>
</a>
</span>
</span>
Free (free of charge)
Free for personal and commercial use.
Author: Authentic Images
Similar Free Stock Images

Premium


Premium


Premium


Premium


Premium


Premium


Premium


Premium


Premium


Premium


Premium


Premium


Premium


Premium


Premium


Premium


Premium


Premium


Premium


Premium


Premium


Premium


Premium


Premium

