
- Home >
- Stock Photos >
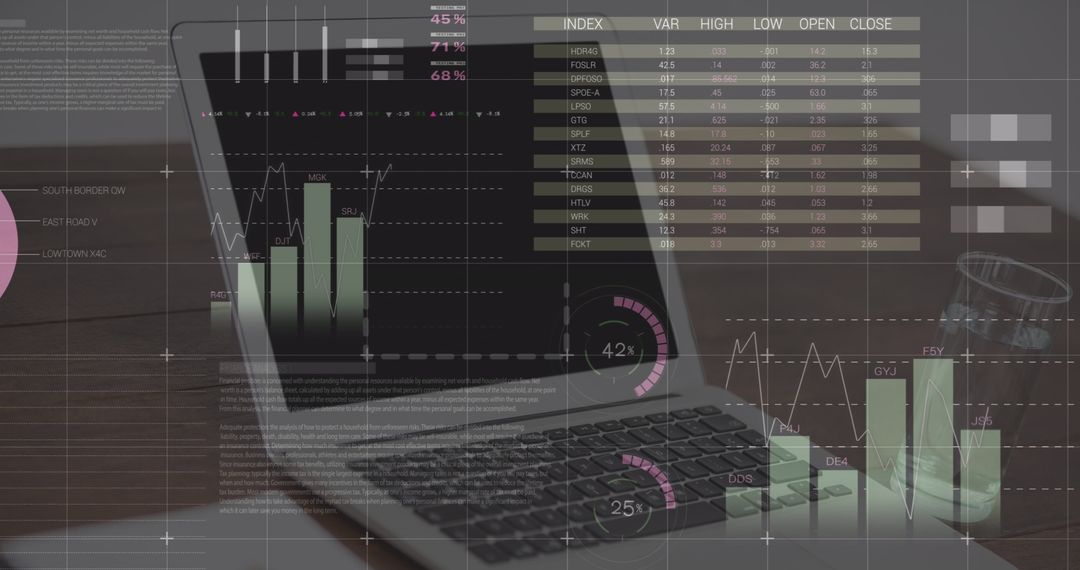
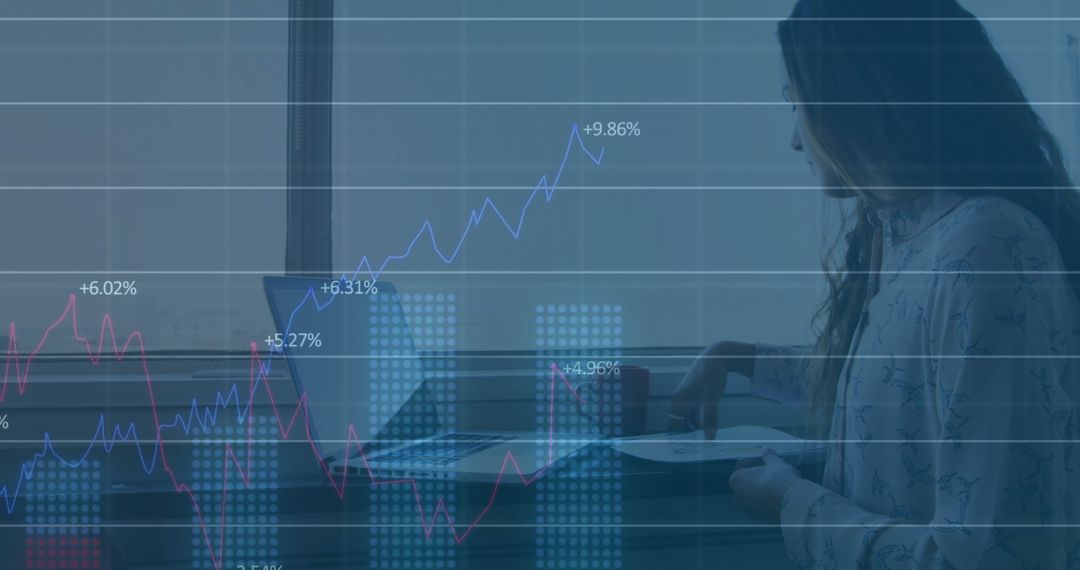
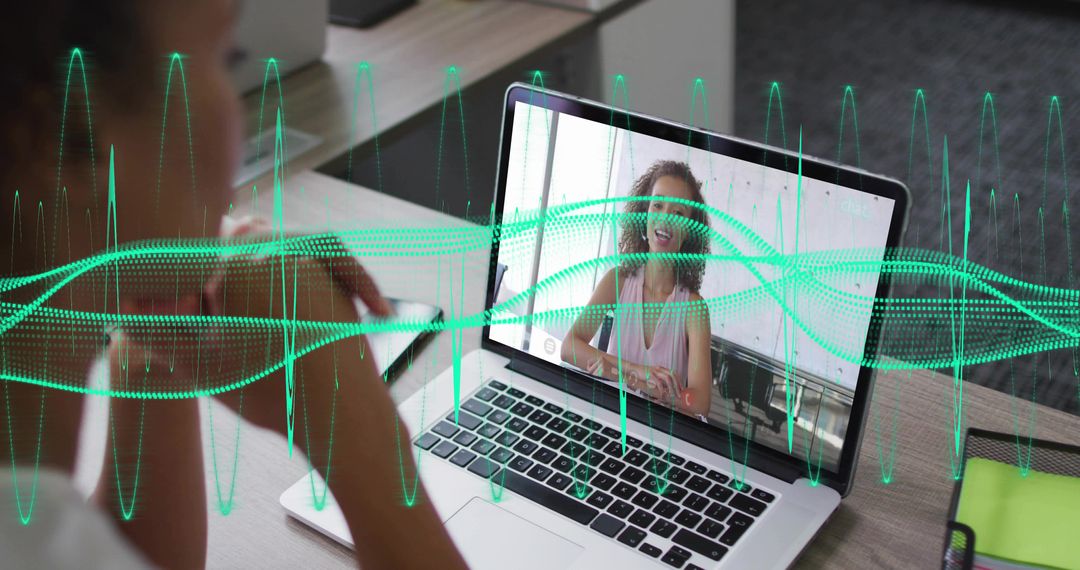
- Writing business notes on laptop with financial charts and analytics overlays
Writing business notes on laptop with financial charts and analytics overlays Image

Woman in light blouse writing notes on notepad while laptop is displaying spreadsheet and bar chart. Semi-transparent financial overlays with colored line graphs and market numbers are adding dynamic data layer across composition. Focus on hands, keyboard, pen and tablet creating sense of active analysis and reporting. Use for business blog headers, finance and investment articles, corporate presentations, annual report covers, social media posts, training materials and marketing collateral. Crop for wide hero banner or square social tile, leave negative space in top-right for headline or logo, apply subtle color grade to match brand palette, and add overlay text or call-to-action for landing page use.
Powered by  - Get 15% off with code: PIKWIZARD15


0
downloads
downloads
Tags:
More
Credit Photo
If you would like to credit the Photo, here are some ways you can do so
Text Link
photo Link
<span class="text-link">
<span>
<a target="_blank" href=https://pikwizard.com/photo/writing-business-notes-on-laptop-with-financial-charts-and-analytics-overlays/a5e883c073c7a916e3cf3f4b36781a0c/>PikWizard</a>
</span>
</span>
<span class="image-link">
<span
style="margin: 0 0 20px 0; display: inline-block; vertical-align: middle; width: 100%;"
>
<a
target="_blank"
href="https://pikwizard.com/photo/writing-business-notes-on-laptop-with-financial-charts-and-analytics-overlays/a5e883c073c7a916e3cf3f4b36781a0c/"
style="text-decoration: none; font-size: 10px; margin: 0;"
>
<img src="https://pikwizard.com/pw/medium/a5e883c073c7a916e3cf3f4b36781a0c.jpg" style="margin: 0; width: 100%;" alt="" />
<p style="font-size: 12px; margin: 0;">PikWizard</p>
</a>
</span>
</span>
Free (free of charge)
Free for personal and commercial use.
Author: People Creations
Similar Free Stock Images
Premium


Premium


Premium


Premium


Premium


Premium


Premium


Premium


Premium


Premium


Premium


Premium


Premium


Premium


Premium


Premium


Premium


Premium


Premium


Premium


Premium


Premium


Premium


Premium

