- Home >
- Stock PNGs >
- Transparent Business Charts and Graphs for Data Analysis
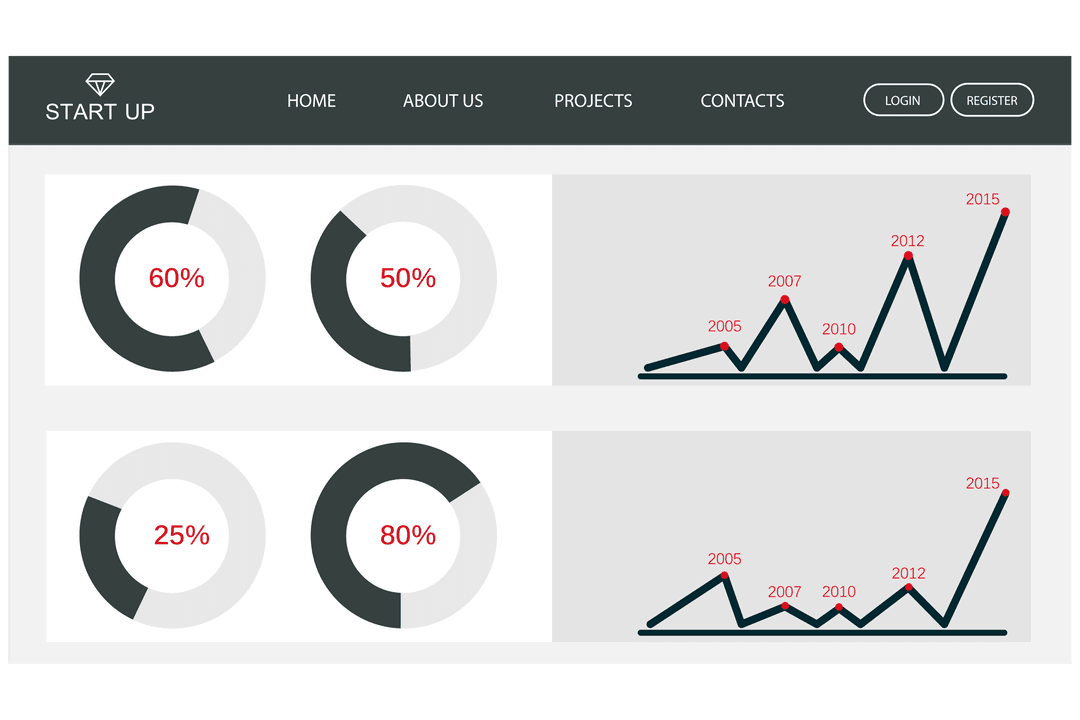
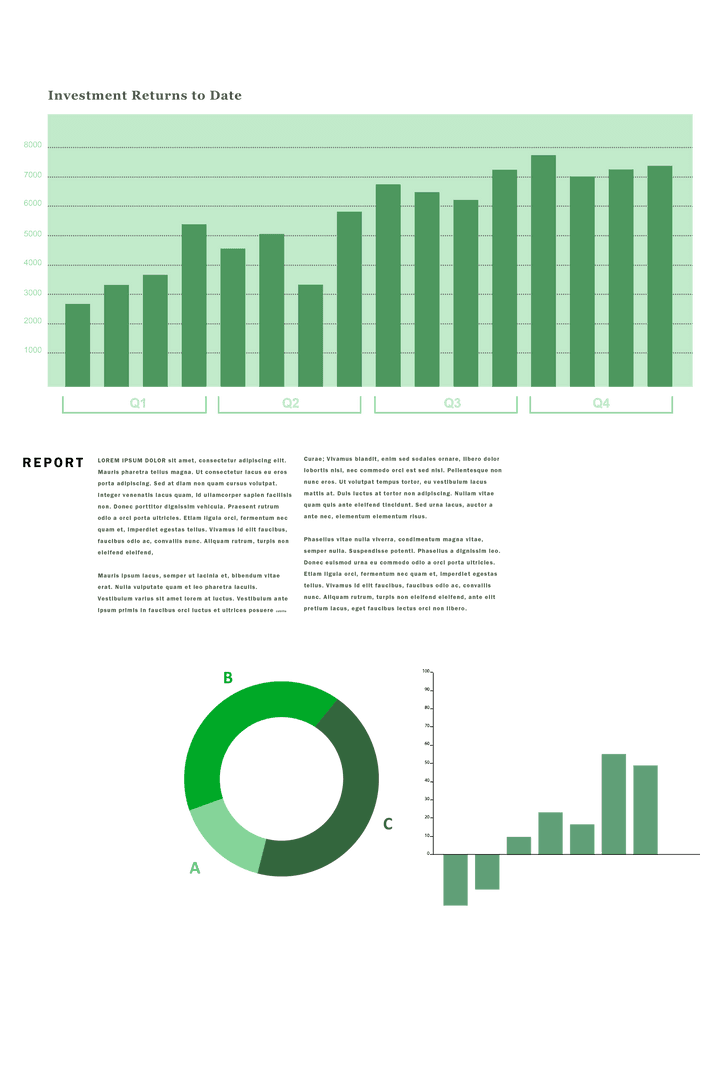
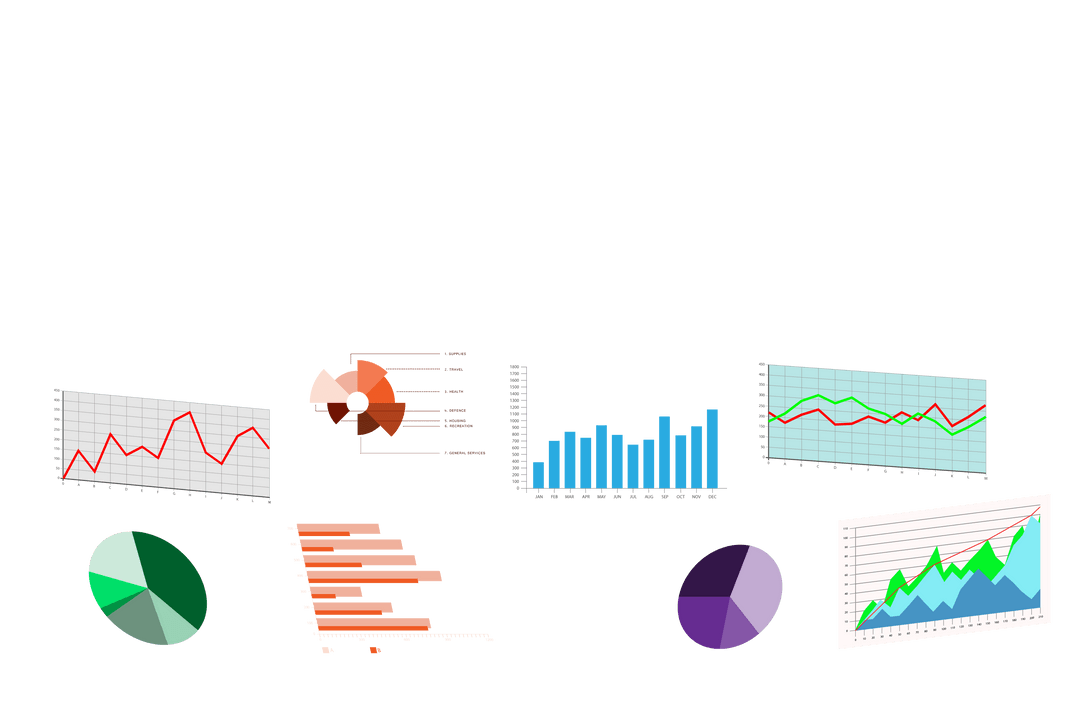
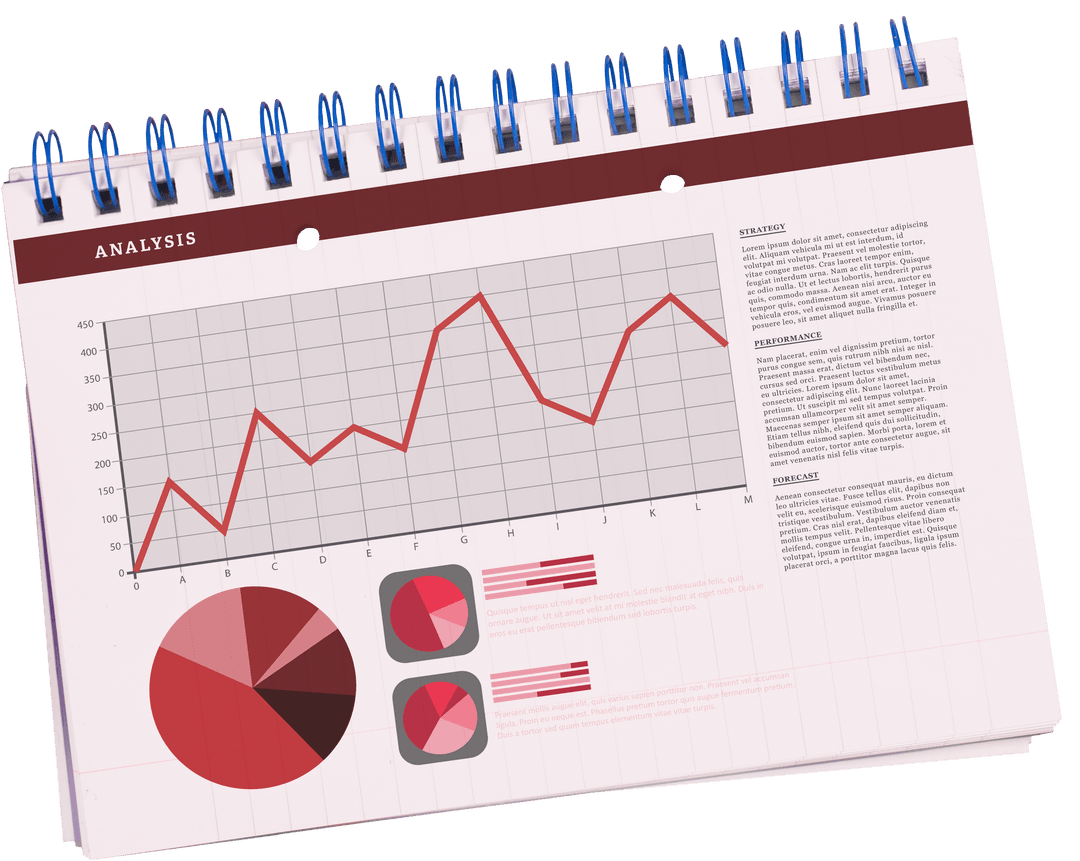
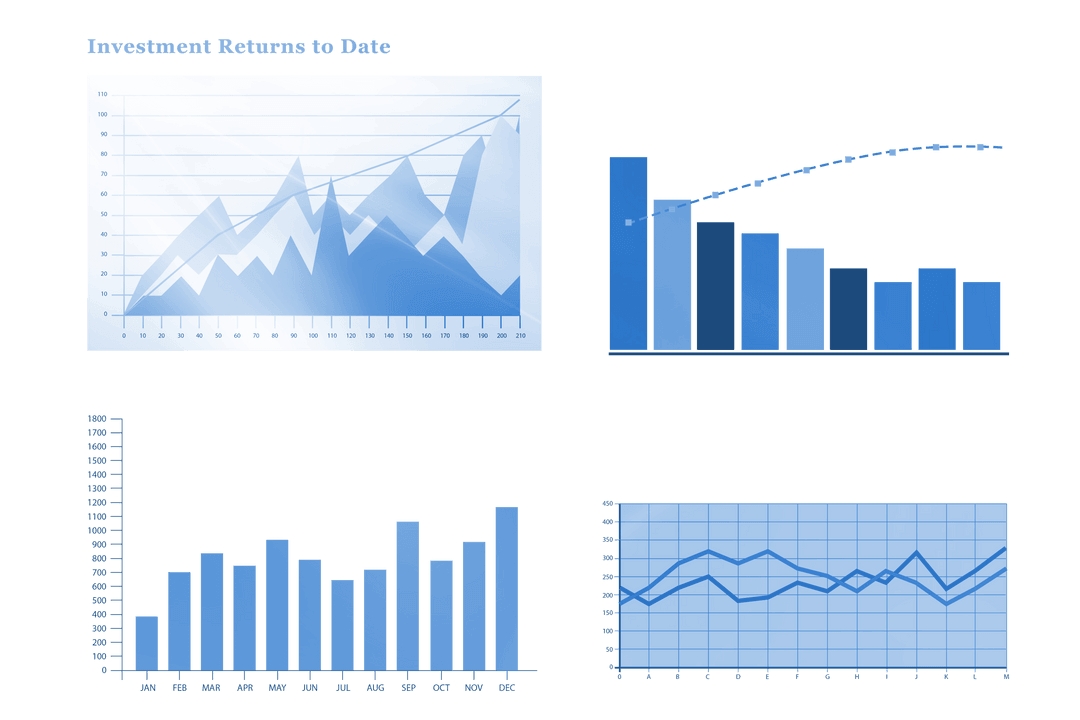
Transparent Business Charts and Graphs for Data Analysis PNG

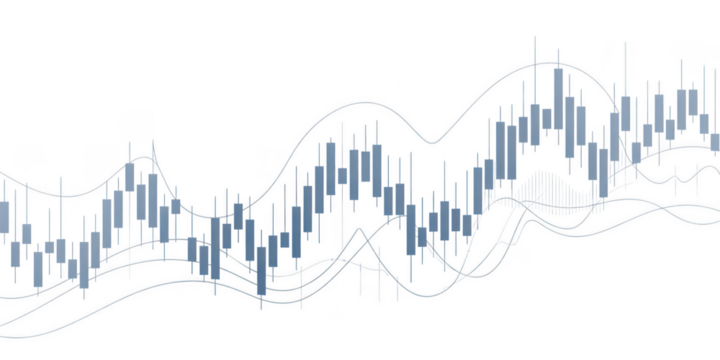
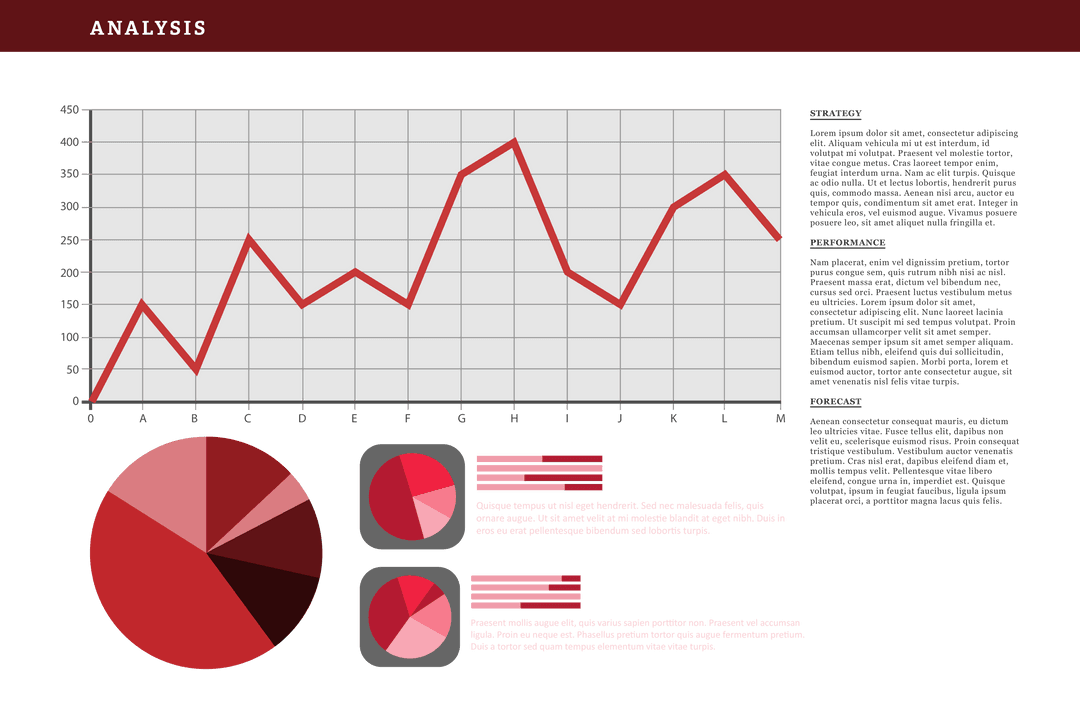
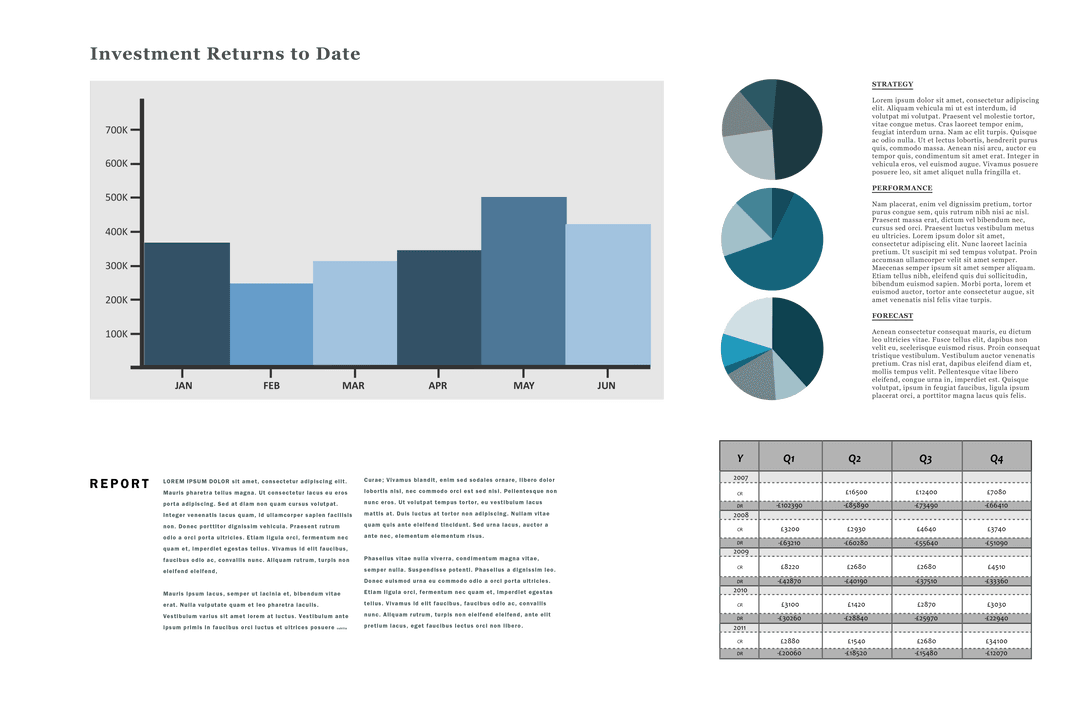
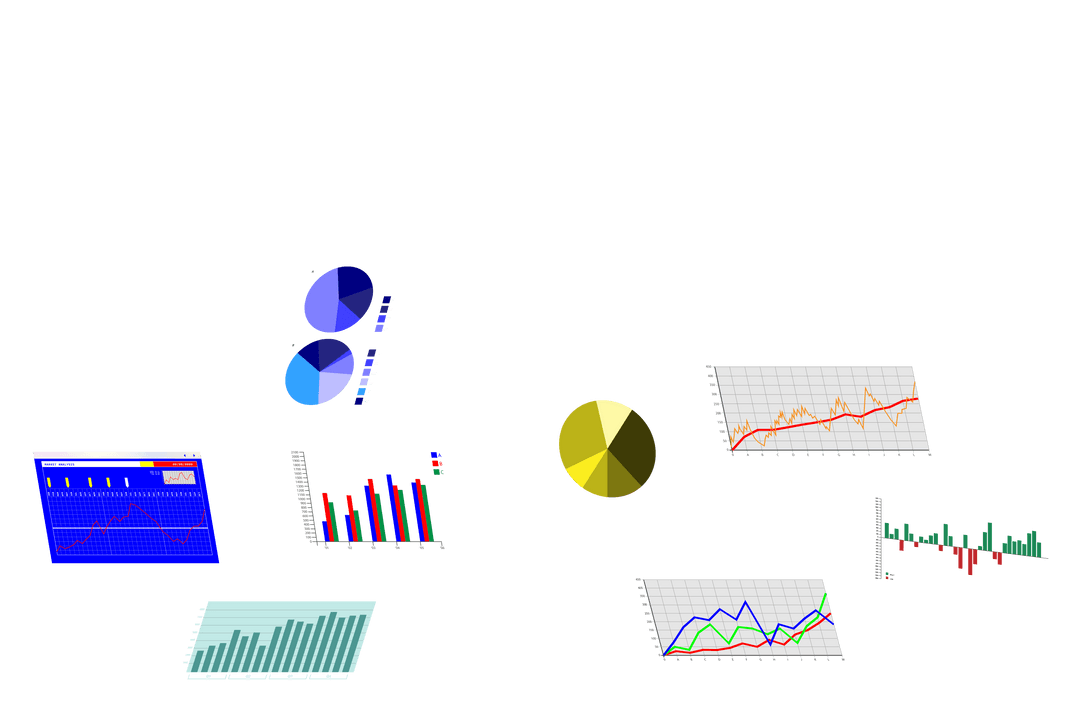
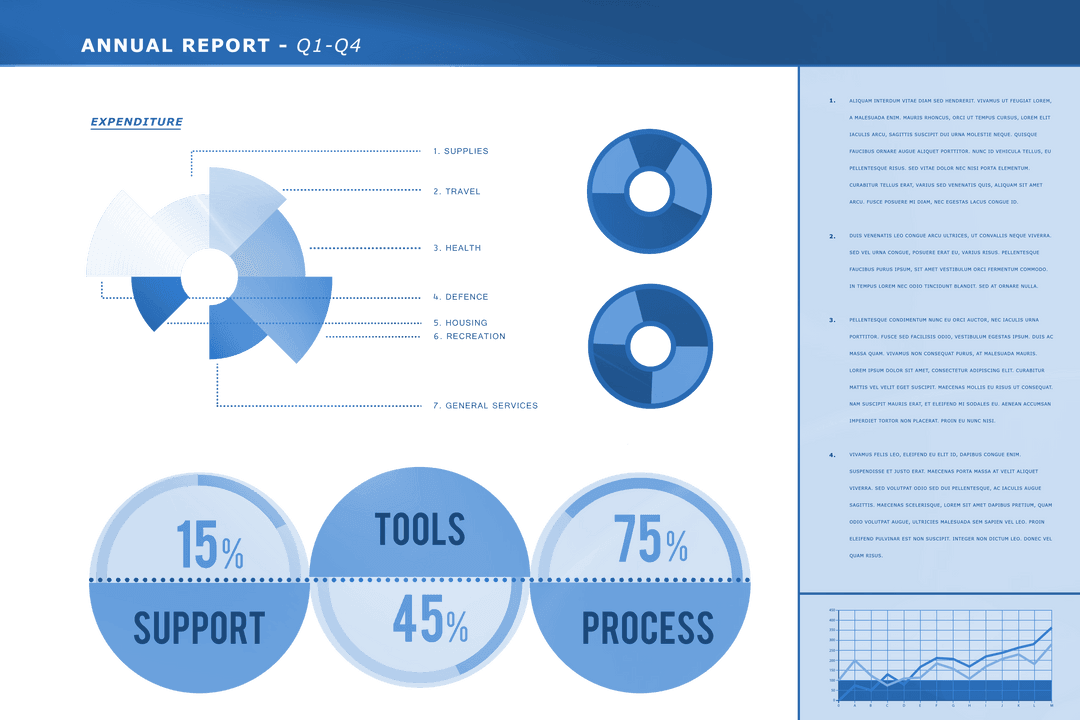
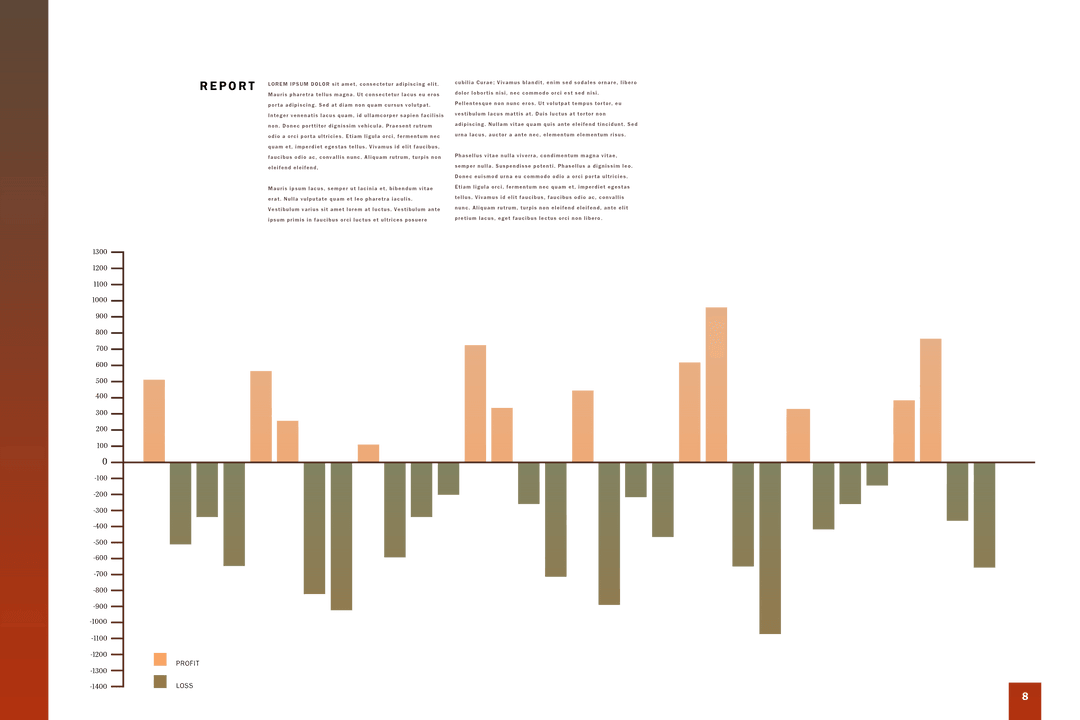
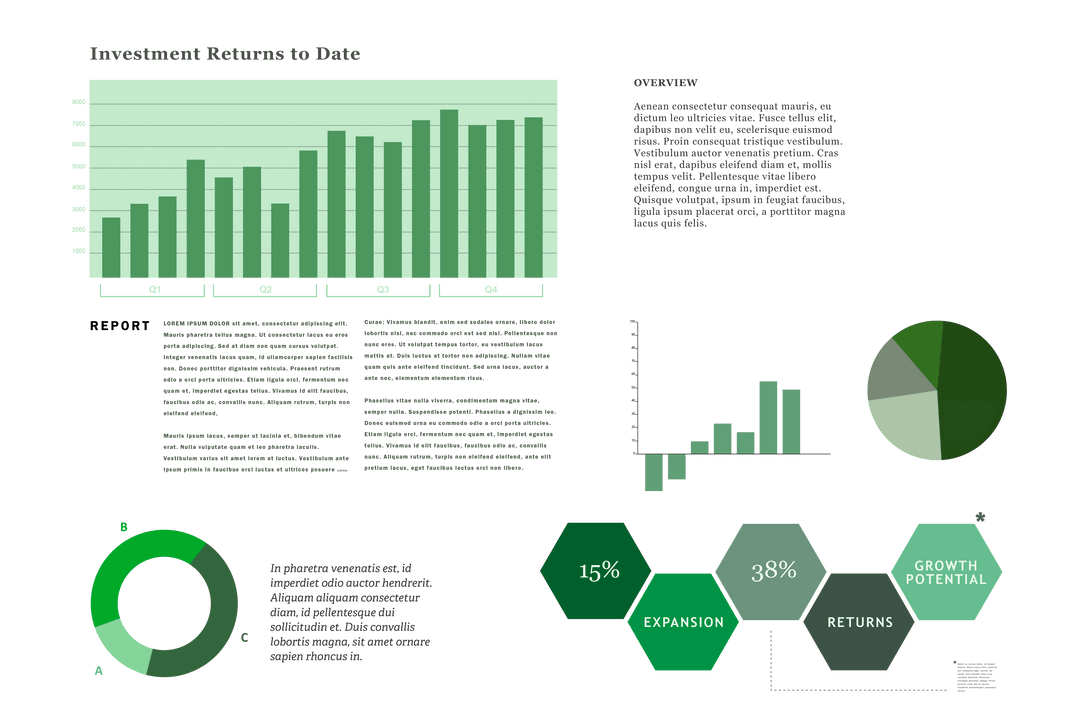
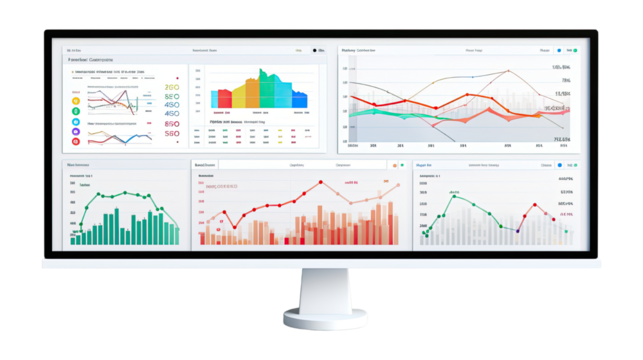
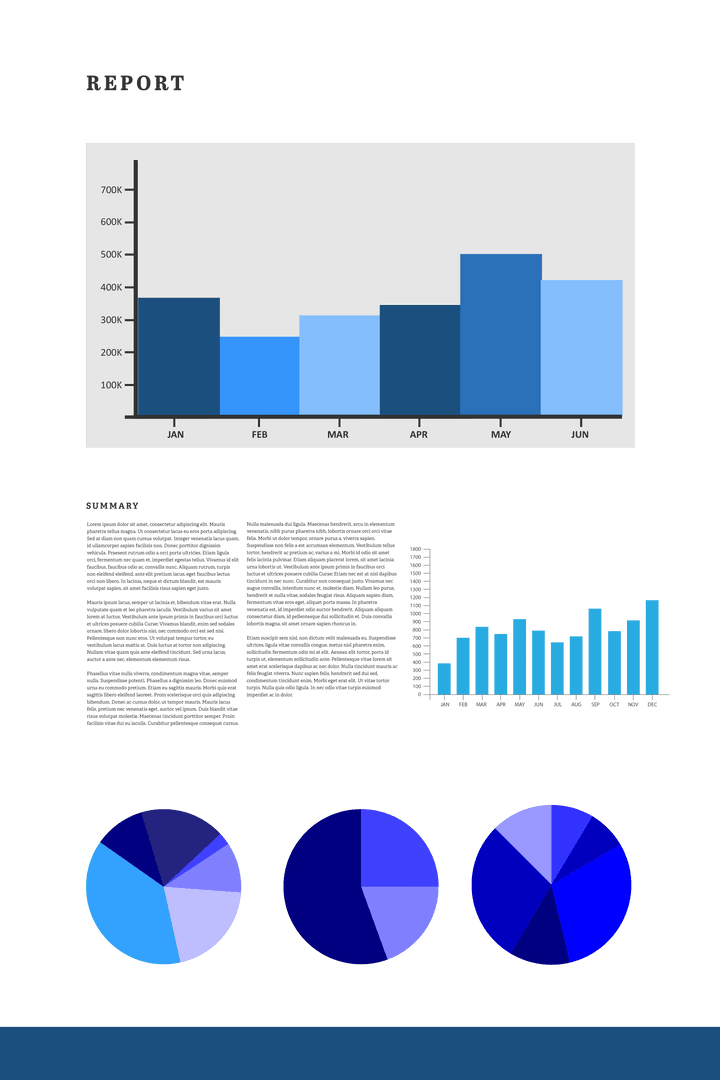
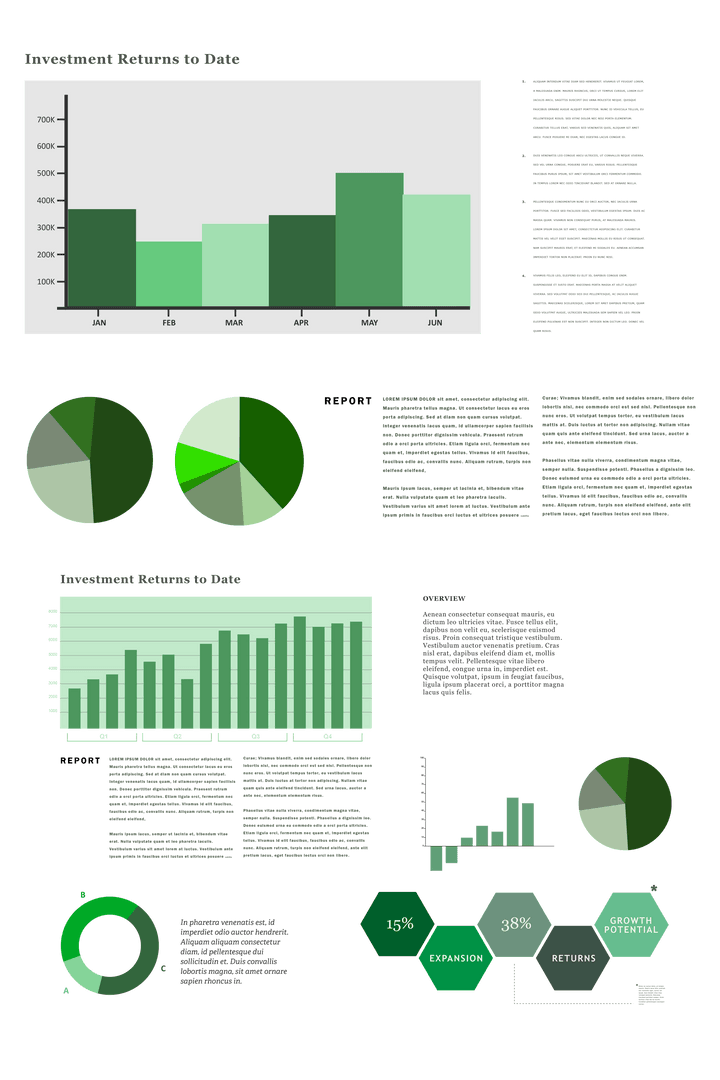
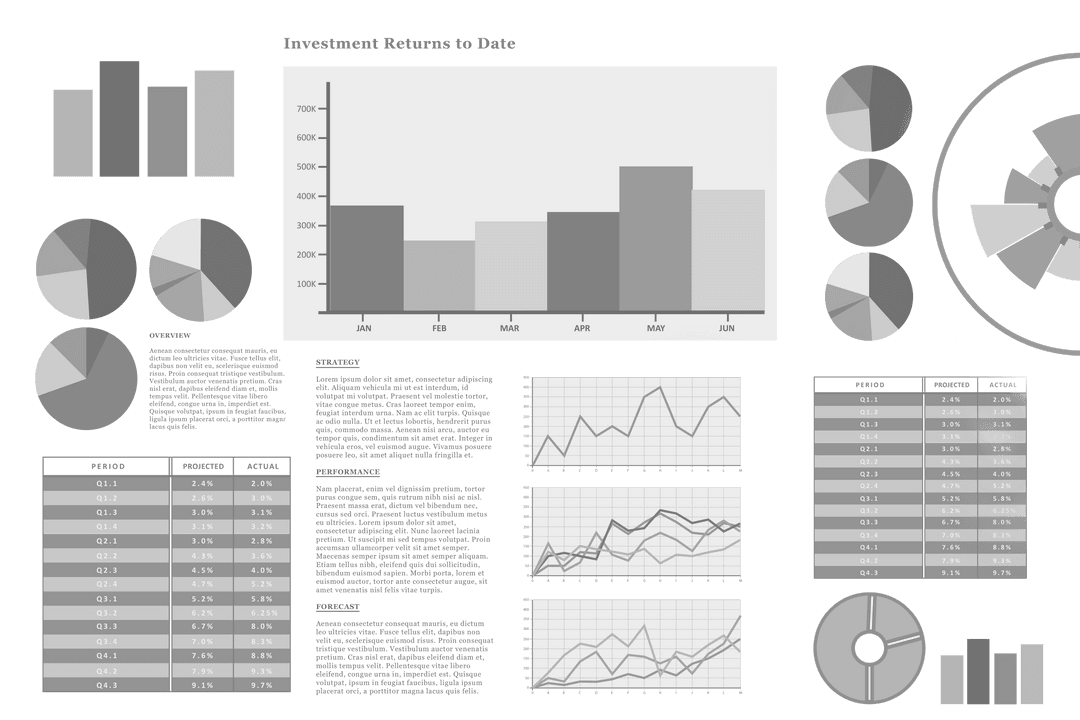
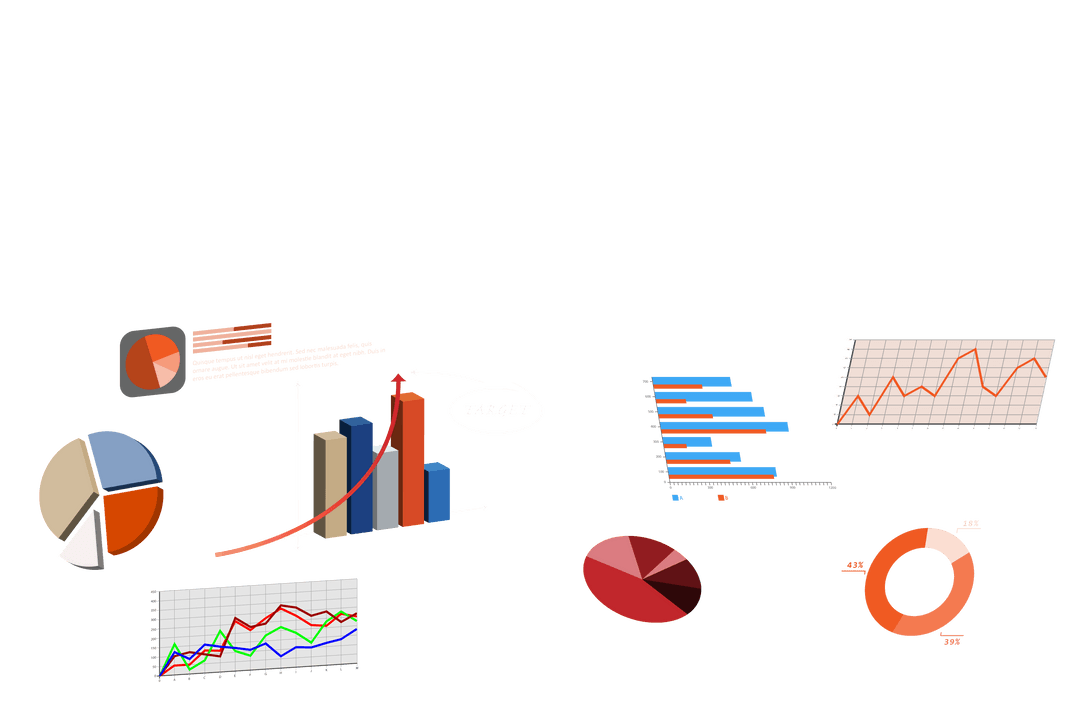
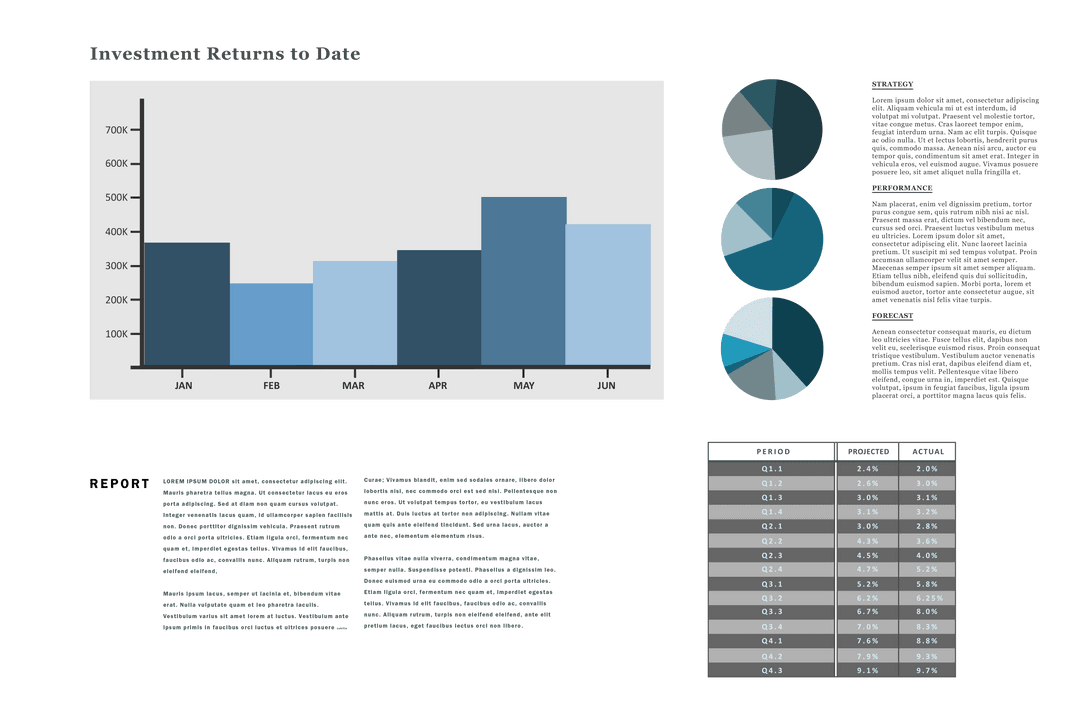
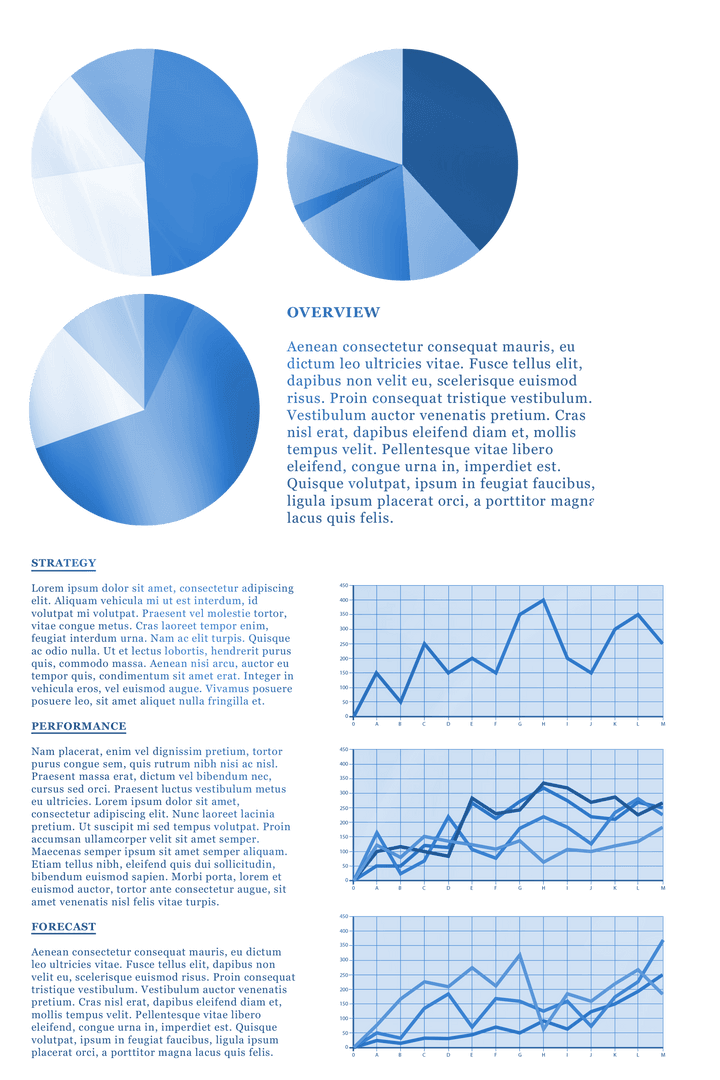
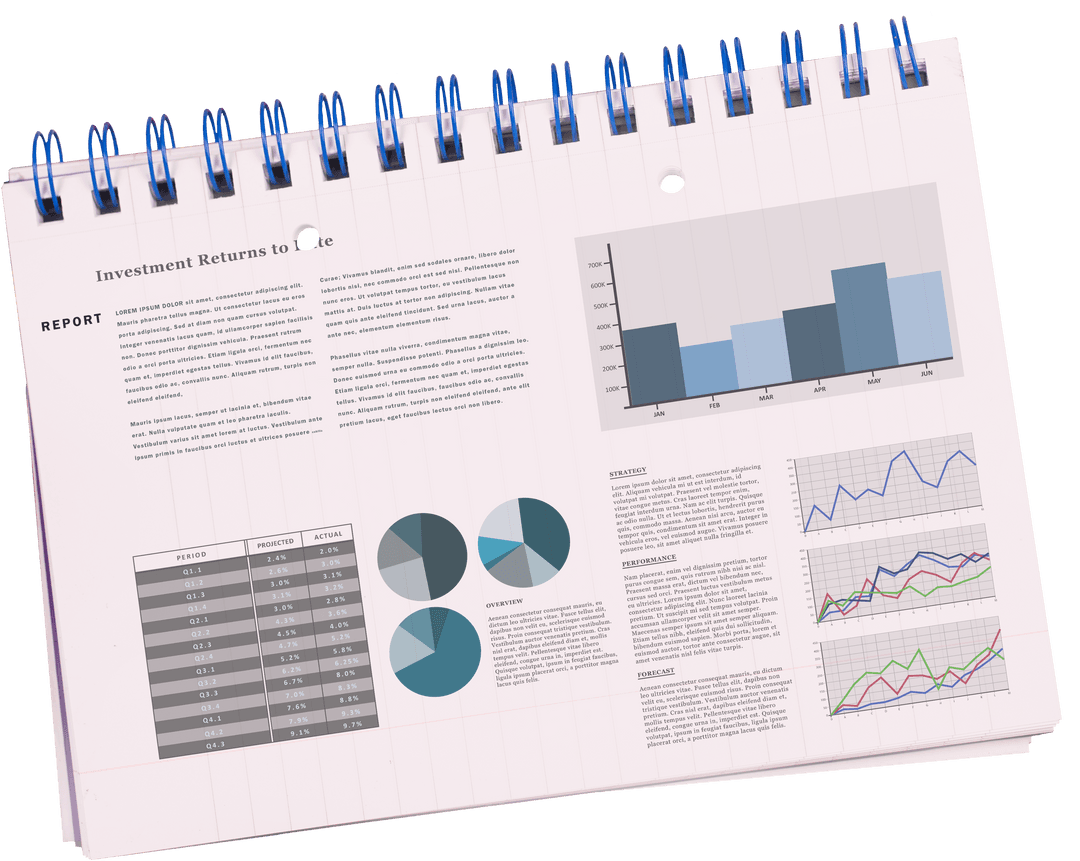
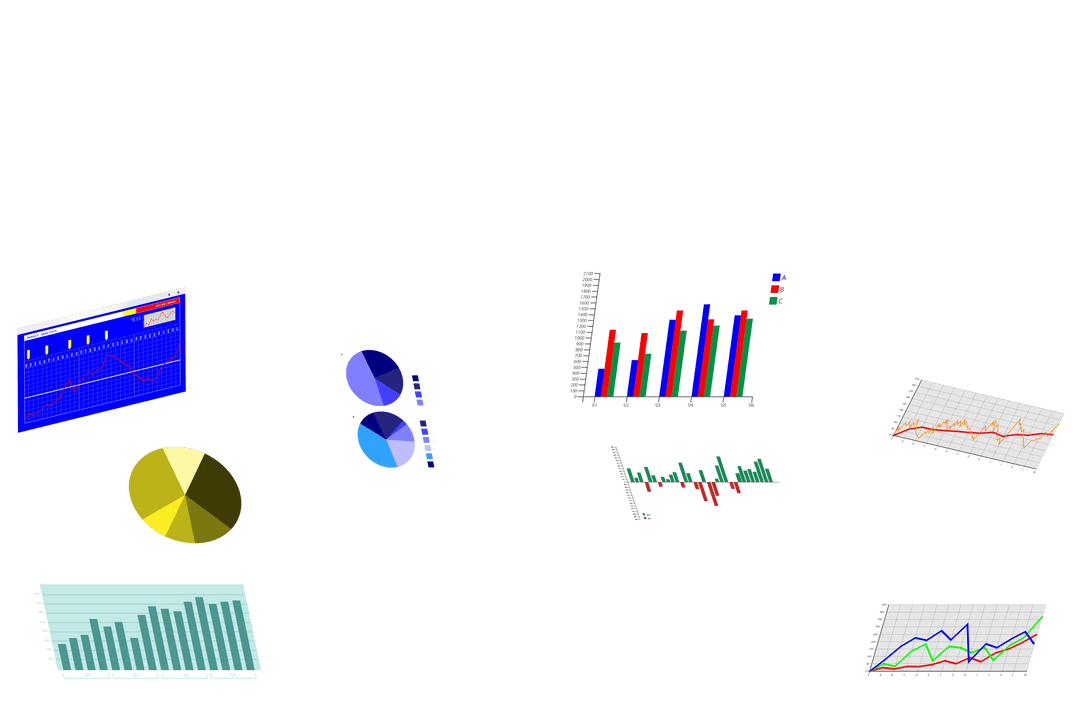
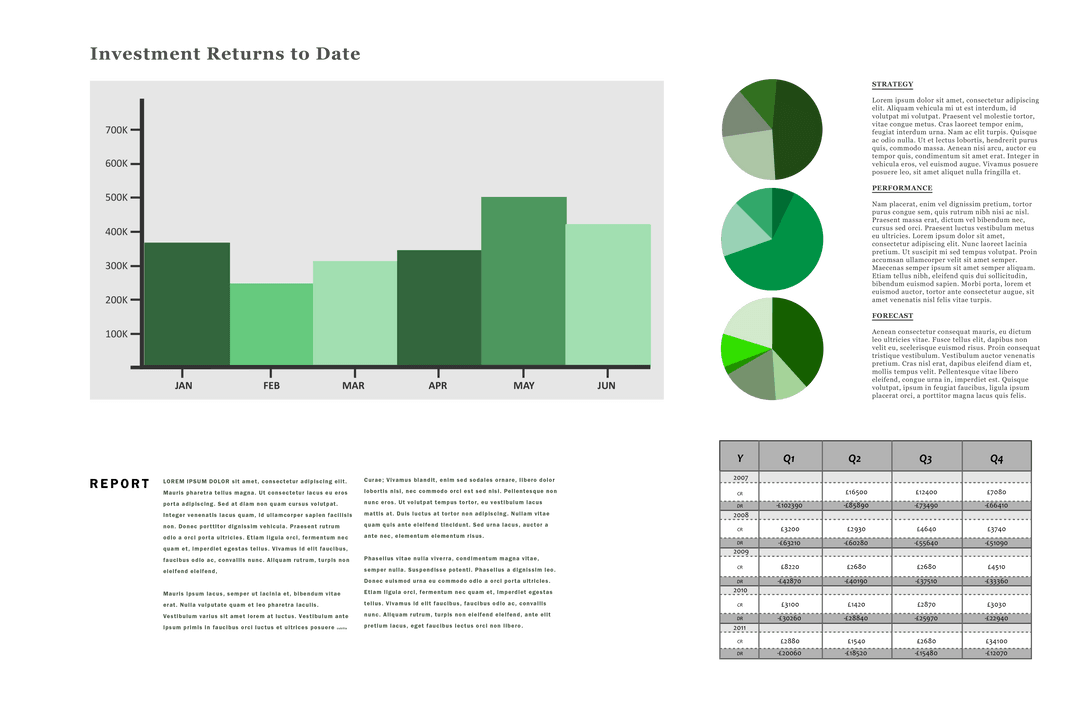
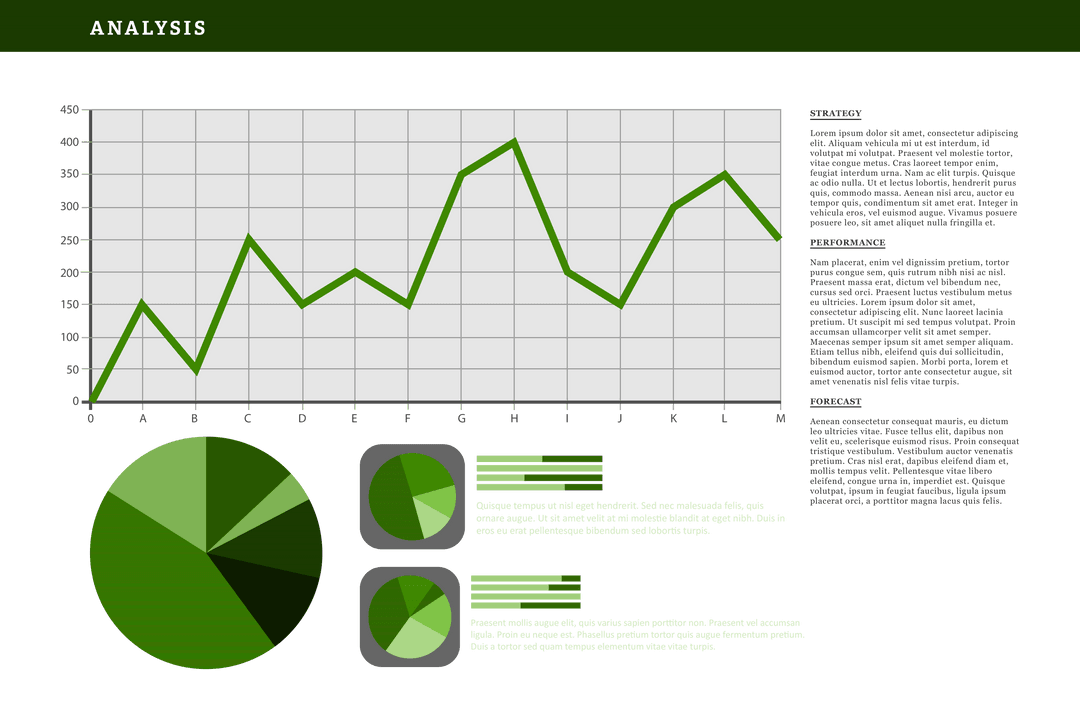
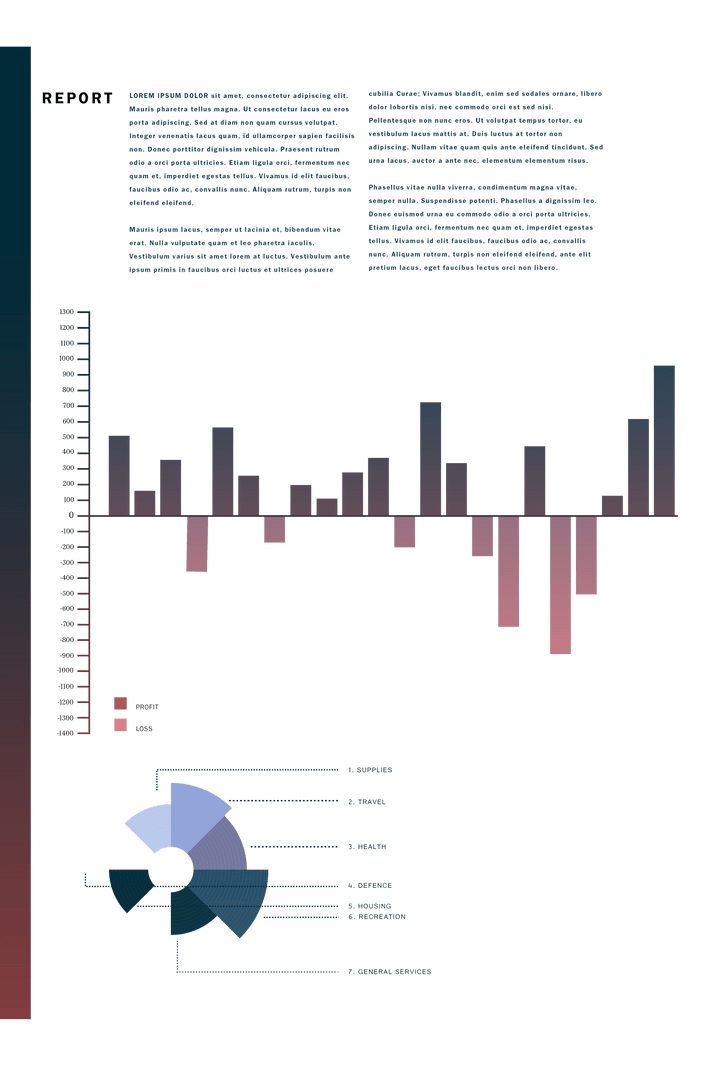
Vector illustration showcasing a variety of colorful business charts and graphs on a transparent background. Includes pie chart, bar graph, and line graph providing data visualization for economic, statistical, and business analysis concepts. Ideal for use in presentations, reports, and educational materials to represent financial statistics and strategic planning data effectively.
Powered by 


1
downloads
downloads
Tags:
More
Credit Photo
If you would like to credit the Photo, here are some ways you can do so
Text Link
png Link
<span class="text-link">
<span>
<a target="_blank" href=https://pikwizard.com/png/transparent-business-charts-and-graphs-for-data-analysis/27c953e332c4fcbd4e15d18800801527/>PikWizard</a>
</span>
</span>
<span class="image-link">
<span
style="margin: 0 0 20px 0; display: inline-block; vertical-align: middle; width: 100%;"
>
<a
target="_blank"
href="https://pikwizard.com/png/transparent-business-charts-and-graphs-for-data-analysis/27c953e332c4fcbd4e15d18800801527/"
style="text-decoration: none; font-size: 10px; margin: 0;"
>
<img src="https://pikwizard.com/pw/medium/27c953e332c4fcbd4e15d18800801527.png" style="margin: 0; width: 100%;" alt="" />
<p style="font-size: 12px; margin: 0;">PikWizard</p>
</a>
</span>
</span>
Free (free of charge)
Free for personal and commercial use.
Author: Creative Art
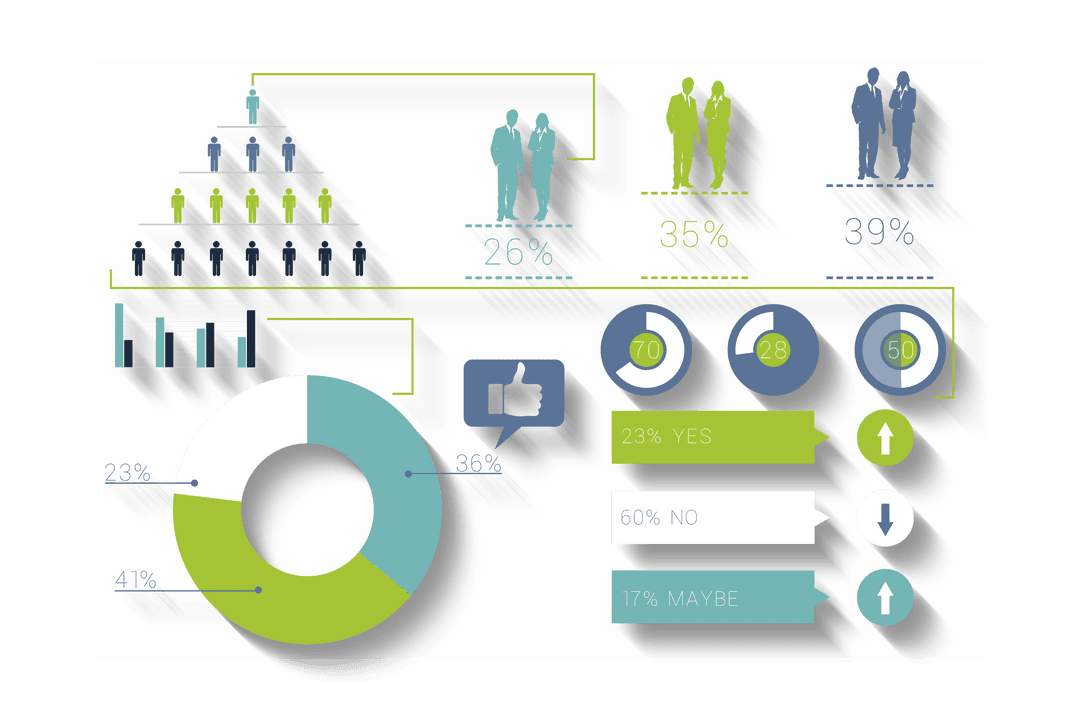
Similar Free PNG Images With Transparent Background
Premium


Premium


Premium

Premium


Premium
Premium


Premium

Premium


Premium

Premium


Premium


Premium


Premium


Premium


Premium

Premium

Premium


Premium


Premium


Premium


Premium


Premium

Premium


Premium