- Home >
- Stock PNGs >
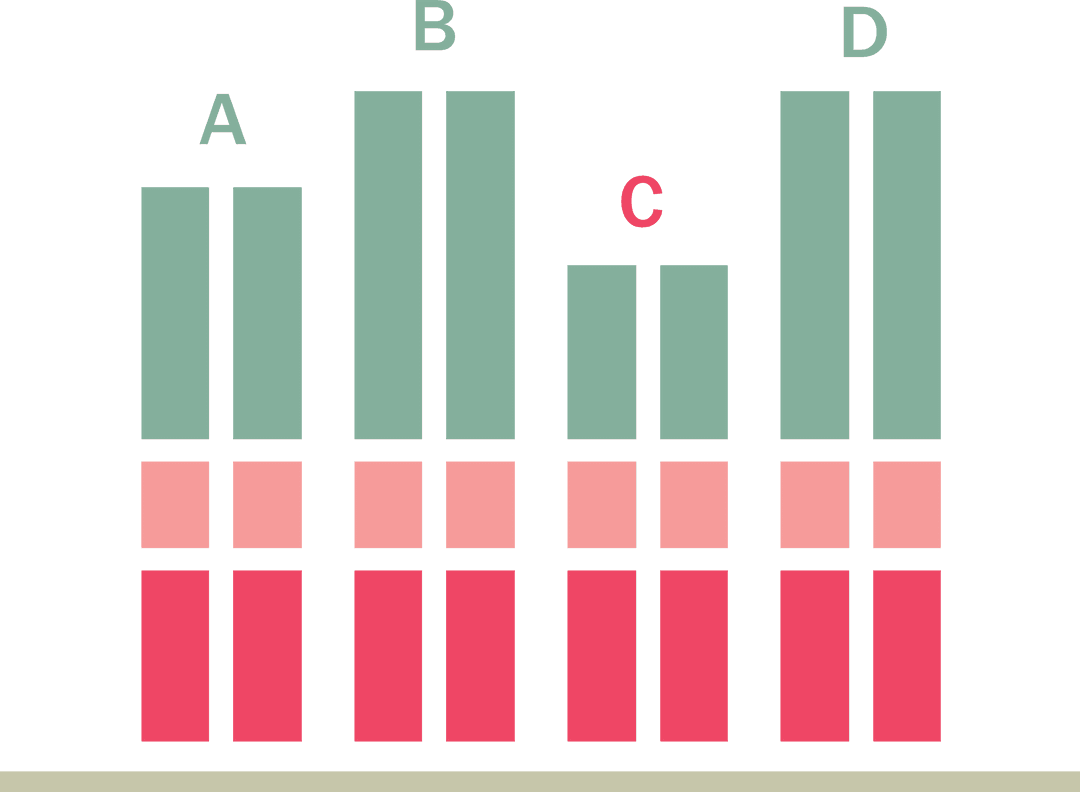
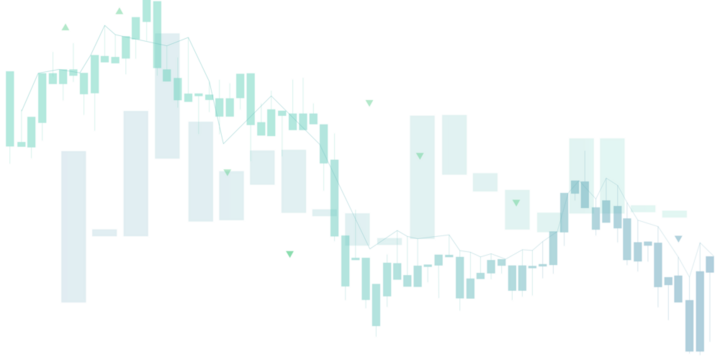
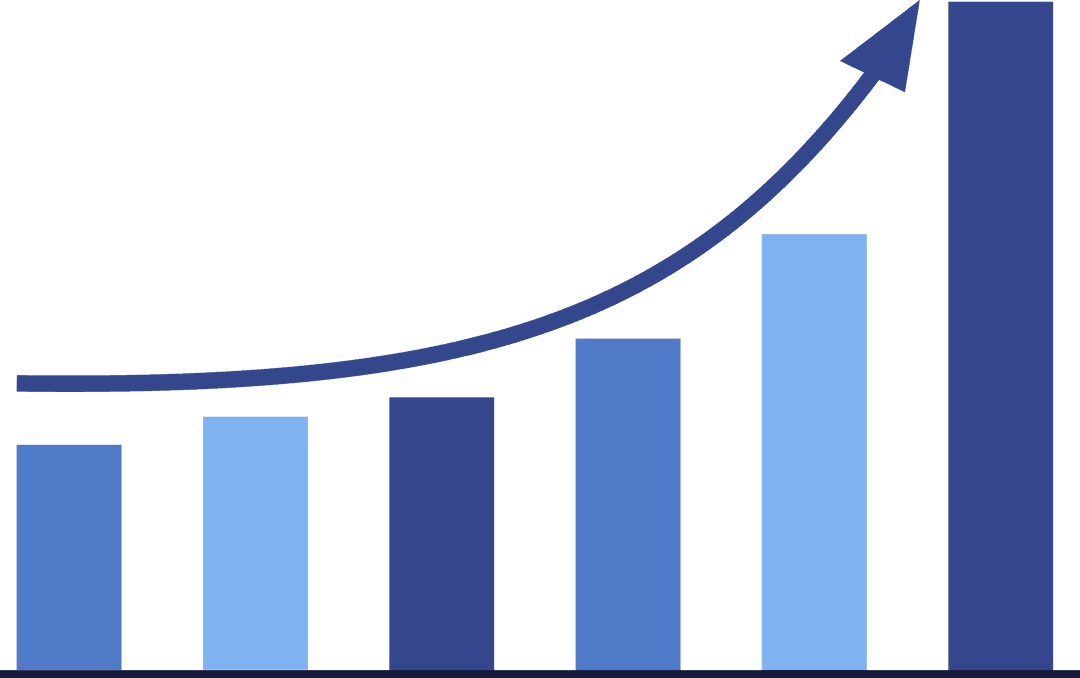
- Transparent Financial Diagram for Business and Statistics
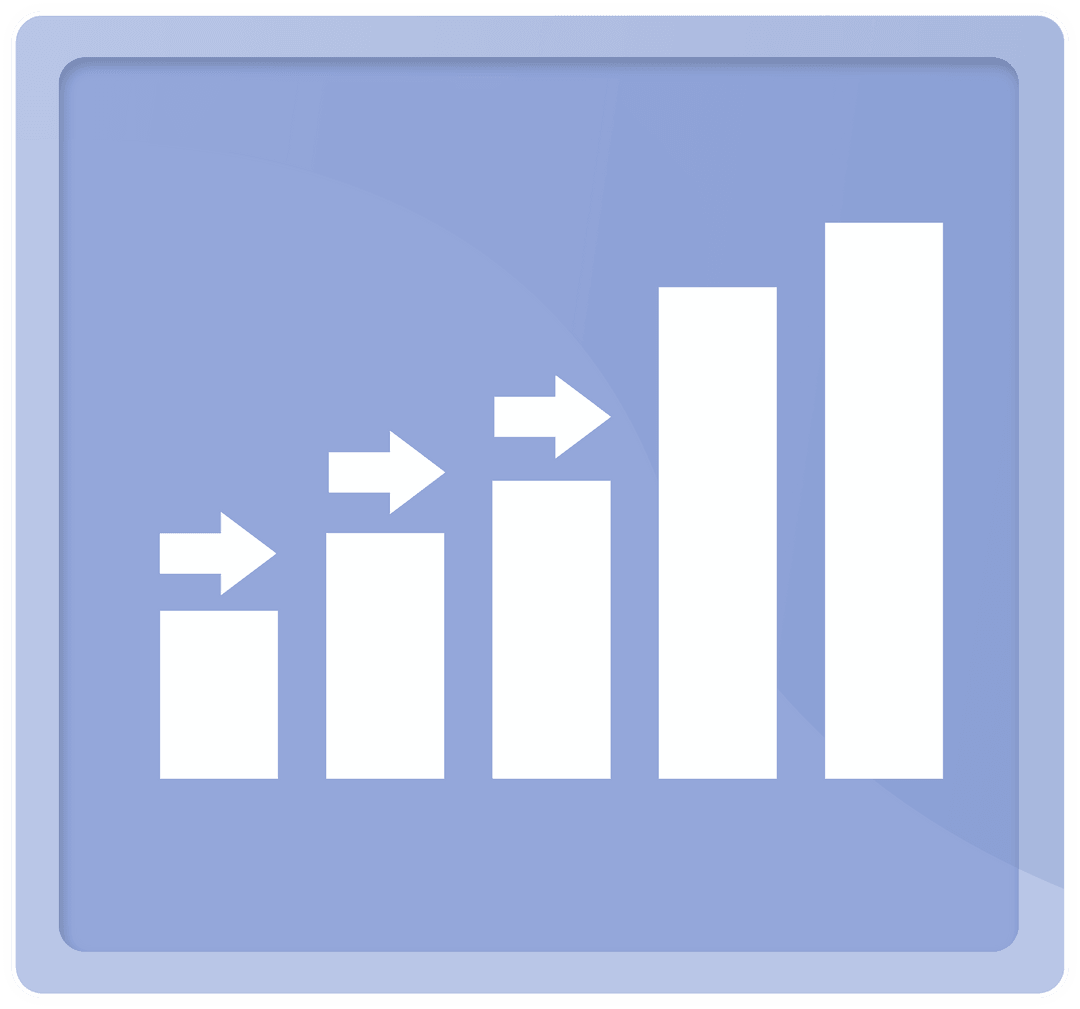
Transparent Financial Diagram for Business and Statistics PNG

This digital illustration of a financial diagram, with bars varying in height, is ideal for portraying financial data. With a transparent background, it can be effortlessly integrated into presentations, websites, and reports to concisely convey business statistics and analyses. Perfect for professionals in finance and investment sectors seeking clear data visualization.
Powered by 


0
downloads
downloads
Tags:
More
Credit Photo
If you would like to credit the Photo, here are some ways you can do so
Text Link
png Link
<span class="text-link">
<span>
<a target="_blank" href=https://pikwizard.com/png/transparent-financial-diagram-for-business-and-statistics/4e52d638d95fd908e0bab0027c810cd1/>PikWizard</a>
</span>
</span>
<span class="image-link">
<span
style="margin: 0 0 20px 0; display: inline-block; vertical-align: middle; width: 100%;"
>
<a
target="_blank"
href="https://pikwizard.com/png/transparent-financial-diagram-for-business-and-statistics/4e52d638d95fd908e0bab0027c810cd1/"
style="text-decoration: none; font-size: 10px; margin: 0;"
>
<img src="https://pikwizard.com/pw/medium/4e52d638d95fd908e0bab0027c810cd1.png" style="margin: 0; width: 100%;" alt="" />
<p style="font-size: 12px; margin: 0;">PikWizard</p>
</a>
</span>
</span>
Free (free of charge)
Free for personal and commercial use.
Author: Creative Art
Similar Free PNG Images With Transparent Background

Premium


Premium


Premium


Premium


Premium


Premium


Premium


Premium


Premium


Premium


Premium


Premium


Premium


Premium


Premium


Premium


Premium


Premium


Premium


Premium


Premium


Premium


Premium


Premium