
- Home >
- Stock Videos >
- Digital Business Interface with Financial Data and Holographic Effects
Digital Business Interface with Financial Data and Holographic Effects Video
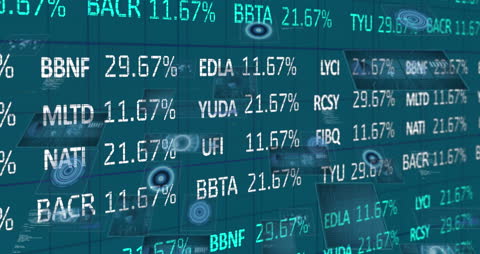
Animation illustrating stock market data with digital interface and holographic visuals designed for enhancing presentations, financial reports, or websites focused on finance and economy.
Powered by 


0
downloads
downloads
Tags:
More
Credit Photo
If you would like to credit the Photo, here are some ways you can do so
Text Link
video Link
<span class="text-link">
<span>
<a target="_blank" href=https://pikwizard.com/video/digital-business-interface-with-financial-data-and-holographic-effects/3a901cddfe695876af8f54bc64fac5f1/>PikWizard</a>
</span>
</span>
<span class="image-link">
<span
style="margin: 0 0 20px 0; display: inline-block; vertical-align: middle; width: 100%;"
>
<a
target="_blank"
href="https://pikwizard.com/video/digital-business-interface-with-financial-data-and-holographic-effects/3a901cddfe695876af8f54bc64fac5f1/"
style="text-decoration: none; font-size: 10px; margin: 0;"
>
<video controls style="width: 100%; margin: 0;">
<source src="https://player.vimeo.com/progressive_redirect/playback/716037860/rendition/240p/file.mp4?loc=external&oauth2_token_id=1223210874&signature=b0432f9141b851aba3b55246ded040d7b64a57d2abf2bf746e7e1ca8f6e182d9" type="video/mp4"
poster="https://pikwizard.com/pw/medium/3a901cddfe695876af8f54bc64fac5f1.jpg"/>
Your browser does not support the video tag.
</video>
<p style="font-size: 12px; margin: 0;">PikWizard</p>
</a>
</span>
</span>
Free (free of charge)
Free for personal and commercial use.
Author: Awesome Content