
- Home >
- Stock Videos >
- Digital Data Visualization of Stock Market Trends
Digital Data Visualization of Stock Market Trends Video
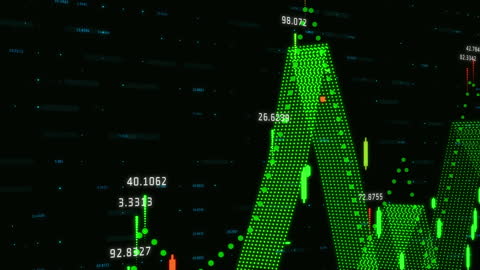
The visual depicts an animated representation of data processing relevant to stock market trends with green indicators against a black backdrop. Suitable for use in presentations about global business, financial analytics, or digital interfaces, this design underscores dynamic data interaction. Ideal element for videos involving economic forecasting or interface demonstrations for market platforms.
Powered by 


0
downloads
downloads
Tags:
More
Credit Photo
If you would like to credit the Photo, here are some ways you can do so
Text Link
video Link
<span class="text-link">
<span>
<a target="_blank" href=https://pikwizard.com/video/digital-data-visualization-of-stock-market-trends/c97c8192089233f3a8e5ddb66bb638b4/>PikWizard</a>
</span>
</span>
<span class="image-link">
<span
style="margin: 0 0 20px 0; display: inline-block; vertical-align: middle; width: 100%;"
>
<a
target="_blank"
href="https://pikwizard.com/video/digital-data-visualization-of-stock-market-trends/c97c8192089233f3a8e5ddb66bb638b4/"
style="text-decoration: none; font-size: 10px; margin: 0;"
>
<video controls style="width: 100%; margin: 0;">
<source src="https://player.vimeo.com/progressive_redirect/playback/790131991/rendition/240p/file.mp4?loc=external&oauth2_token_id=1223210874&signature=c0fe88e74fcd3458f5c4a47f8d0e56fa3e7c959450ddfcc138ddbffb6ab0807a" type="video/mp4"
poster="https://pikwizard.com/pw/medium/c97c8192089233f3a8e5ddb66bb638b4.jpg"/>
Your browser does not support the video tag.
</video>
<p style="font-size: 12px; margin: 0;">PikWizard</p>
</a>
</span>
</span>
Free (free of charge)
Free for personal and commercial use.
Author: Awesome Content