
- Home >
- Stock Videos >
- Digital Visualization of Financial Data Analysis in Modern Office
Digital Visualization of Financial Data Analysis in Modern Office Video

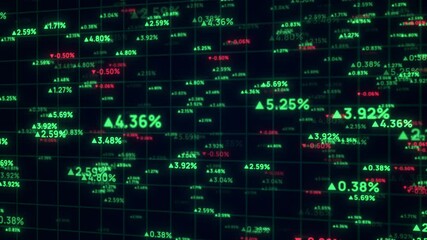
Digital overlay of financial data and graphs creating a layered visual with office setting in background. Ideal for illustrating modern business environments, showcasing data-driven decision making, or representing economic growth and innovation. Suitable for financial reports, branding for tech companies, or educational materials on business and statistics.
Powered by 


0
downloads
downloads
Tags:
More
Credit Photo
If you would like to credit the Photo, here are some ways you can do so
Text Link
video Link
<span class="text-link">
<span>
<a target="_blank" href=https://pikwizard.com/video/digital-visualization-of-financial-data-analysis-in-modern-office/0386c350ead7d21bfb744d3a9917f752/>PikWizard</a>
</span>
</span>
<span class="image-link">
<span
style="margin: 0 0 20px 0; display: inline-block; vertical-align: middle; width: 100%;"
>
<a
target="_blank"
href="https://pikwizard.com/video/digital-visualization-of-financial-data-analysis-in-modern-office/0386c350ead7d21bfb744d3a9917f752/"
style="text-decoration: none; font-size: 10px; margin: 0;"
>
<video controls style="width: 100%; margin: 0;">
<source src="https://player.vimeo.com/progressive_redirect/playback/778593689/rendition/240p/file.mp4?loc=external&oauth2_token_id=1223210874&signature=079a72ae642acace08a9c672d409ec96564777444cd6c8a3da23797a237d3dd2" type="video/mp4"
poster="https://pikwizard.com/pw/medium/0386c350ead7d21bfb744d3a9917f752.jpg"/>
Your browser does not support the video tag.
</video>
<p style="font-size: 12px; margin: 0;">PikWizard</p>
</a>
</span>
</span>
Free (free of charge)
Free for personal and commercial use.
Author: Awesome Content