
- Home >
- Stock Videos >
- Dynamic Graph Showing Downward Trend in Urban Financial Market
Dynamic Graph Showing Downward Trend in Urban Financial Market Video
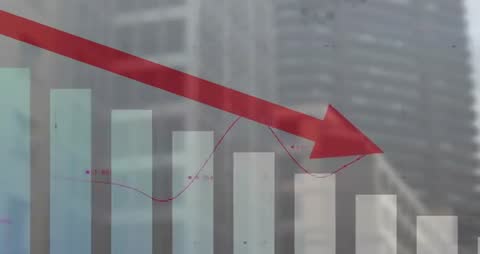
Video frame illustrates dynamic economic activity with a descending red arrow emphasizing decline over bar graph in a cityscape. Useful for presentations, finance apps, or blogs discussing market trends, economic transitions, or investment strategies in urban settings.
Powered by 


0
downloads
downloads
Tags:
More
Credit Photo
If you would like to credit the Photo, here are some ways you can do so
Text Link
video Link
<span class="text-link">
<span>
<a target="_blank" href=https://pikwizard.com/video/dynamic-graph-showing-downward-trend-in-urban-financial-market/5ce65798e2b9dea11b46f91bdde0a1f4/>PikWizard</a>
</span>
</span>
<span class="image-link">
<span
style="margin: 0 0 20px 0; display: inline-block; vertical-align: middle; width: 100%;"
>
<a
target="_blank"
href="https://pikwizard.com/video/dynamic-graph-showing-downward-trend-in-urban-financial-market/5ce65798e2b9dea11b46f91bdde0a1f4/"
style="text-decoration: none; font-size: 10px; margin: 0;"
>
<video controls style="width: 100%; margin: 0;">
<source src="https://player.vimeo.com/progressive_redirect/playback/1109722915/rendition/240p/file.mp4?loc=external&oauth2_token_id=1223210874&signature=534d89cc6599d8d19fd8984b3495fd19de2697fb805b539e49ac6c80fc2cac75" type="video/mp4"
poster="https://pikwizard.com/pw/medium/5ce65798e2b9dea11b46f91bdde0a1f4.jpg"/>
Your browser does not support the video tag.
</video>
<p style="font-size: 12px; margin: 0;">PikWizard</p>
</a>
</span>
</span>
Free (free of charge)
Free for personal and commercial use.
Author: Awesome Content