
- Home >
- Stock Videos >
- Dynamic Visualization of Financial Data Innovations
Dynamic Visualization of Financial Data Innovations Video
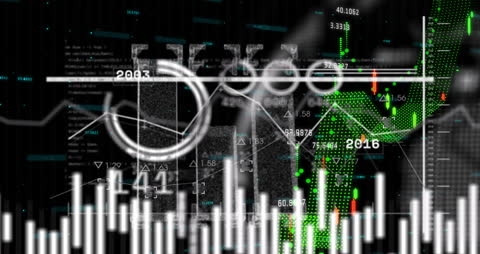
Energetic animation of financial data processing illustrates dynamic trends in global finance. Charts and graphs illuminate fluctuation, helpful for presentations on economic analysis, investments, and stock market technology. Useful as a backdrop in videos on finance education and fintech innovations.
Powered by 


1
downloads
downloads
Tags:
More
Credit Photo
If you would like to credit the Photo, here are some ways you can do so
Text Link
video Link
<span class="text-link">
<span>
<a target="_blank" href=https://pikwizard.com/video/dynamic-visualization-of-financial-data-innovations/117f687598c12c244052e97de57bd722/>PikWizard</a>
</span>
</span>
<span class="image-link">
<span
style="margin: 0 0 20px 0; display: inline-block; vertical-align: middle; width: 100%;"
>
<a
target="_blank"
href="https://pikwizard.com/video/dynamic-visualization-of-financial-data-innovations/117f687598c12c244052e97de57bd722/"
style="text-decoration: none; font-size: 10px; margin: 0;"
>
<video controls style="width: 100%; margin: 0;">
<source src="https://player.vimeo.com/progressive_redirect/playback/908518337/rendition/240p/file.mp4?loc=external&oauth2_token_id=1223210874&signature=04b3c08cde895021db784dc00b157e655eedfa684df2fb07491dd3673909123f" type="video/mp4"
poster="https://pikwizard.com/pw/medium/117f687598c12c244052e97de57bd722.jpg"/>
Your browser does not support the video tag.
</video>
<p style="font-size: 12px; margin: 0;">PikWizard</p>
</a>
</span>
</span>
Free (free of charge)
Free for personal and commercial use.
Author: Awesome Content