
- Home >
- Stock Videos >
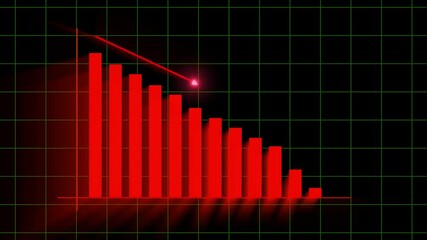
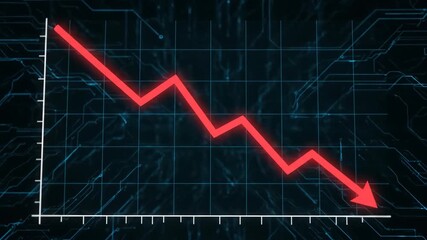
- Economic Downturn Concept with Graphs and Banknote
Economic Downturn Concept with Graphs and Banknote Video

Illustration showing economic challenges by overlapping graphs on banknote, suggesting decline or crisis. Ideal for use in financial news articles, economic trend analysis, visual aids for presentations on global markets and investor briefings addressing financial downturns.
Powered by 


0
downloads
downloads
Tags:
More
Credit Photo
If you would like to credit the Photo, here are some ways you can do so
Text Link
video Link
<span class="text-link">
<span>
<a target="_blank" href=https://pikwizard.com/video/economic-downturn-concept-with-graphs-and-banknote/2ac275770716755a702b0c79967ed9b5/>PikWizard</a>
</span>
</span>
<span class="image-link">
<span
style="margin: 0 0 20px 0; display: inline-block; vertical-align: middle; width: 100%;"
>
<a
target="_blank"
href="https://pikwizard.com/video/economic-downturn-concept-with-graphs-and-banknote/2ac275770716755a702b0c79967ed9b5/"
style="text-decoration: none; font-size: 10px; margin: 0;"
>
<video controls style="width: 100%; margin: 0;">
<source src="https://player.vimeo.com/progressive_redirect/playback/910603071/rendition/240p/file.mp4?loc=external&oauth2_token_id=1223210874&signature=8b48b4a8b34bed2a79828feb72e3f62fa5c4f1974ede93f58704bd007c1cac6c" type="video/mp4"
poster="https://pikwizard.com/pw/medium/2ac275770716755a702b0c79967ed9b5.jpg"/>
Your browser does not support the video tag.
</video>
<p style="font-size: 12px; margin: 0;">PikWizard</p>
</a>
</span>
</span>
Free (free of charge)
Free for personal and commercial use.
Author: Awesome Content