
- Home >
- Stock Videos >
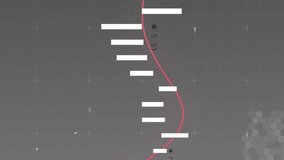
- Financial Chart with Candlestick Trend Lines Indicating Market Movement
Financial Chart with Candlestick Trend Lines Indicating Market Movement Video

The video portrays a digital financial chart with candlestick and trend lines in shades of blue and green, demonstrating upward and downward movements, suggesting economic market trends. This abstract design can be used in finance-related presentations, educational materials, or as a visual aid for investors assessing market movements. It effectively illustrates key concepts in technical analysis and data visualization.
Powered by  - Get 15% off with code: PIKWIZARD15


0
downloads
downloads
Tags:
More
Credit Photo
If you would like to credit the Photo, here are some ways you can do so
Text Link
video Link
<span class="text-link">
<span>
<a target="_blank" href=https://pikwizard.com/video/financial-chart-with-candlestick-trend-lines-indicating-market-movement/09f2d237ad0fed689ae56e5e7ce9e9ac/>PikWizard</a>
</span>
</span>
<span class="image-link">
<span
style="margin: 0 0 20px 0; display: inline-block; vertical-align: middle; width: 100%;"
>
<a
target="_blank"
href="https://pikwizard.com/video/financial-chart-with-candlestick-trend-lines-indicating-market-movement/09f2d237ad0fed689ae56e5e7ce9e9ac/"
style="text-decoration: none; font-size: 10px; margin: 0;"
>
<video controls style="width: 100%; margin: 0;">
<source src="https://player.vimeo.com/progressive_redirect/playback/1089246199/rendition/240p/file.mp4?loc=external&oauth2_token_id=1223210874&signature=08317ec7e215703be8777bc0945b69785351a306d0f513661ff2a245332bb23f" type="video/mp4"
poster="https://pikwizard.com/pw/medium/09f2d237ad0fed689ae56e5e7ce9e9ac.jpg"/>
Your browser does not support the video tag.
</video>
<p style="font-size: 12px; margin: 0;">PikWizard</p>
</a>
</span>
</span>
Free (free of charge)
Free for personal and commercial use.
Author: Awesome Content