
- Home >
- Stock Videos >
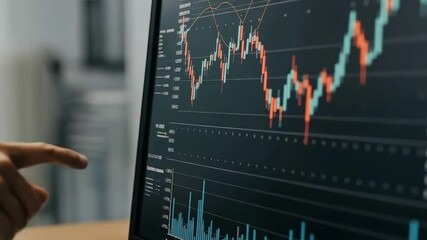
- Financial Data Visualization with Stock and Market Trends
Financial Data Visualization with Stock and Market Trends Video

Visual representing dynamic financial data and analysis, ideal for cases involving stock markets and global economic trends discussions or presentations. Suitable for illustrating complex investment strategies or financial services marketing material.
Powered by 


2
downloads
downloads
Tags:
More
Credit Photo
If you would like to credit the Photo, here are some ways you can do so
Text Link
video Link
<span class="text-link">
<span>
<a target="_blank" href=https://pikwizard.com/video/financial-data-visualization-with-stock-and-market-trends/aea843bc902d07d4566747ab79de70a8/>PikWizard</a>
</span>
</span>
<span class="image-link">
<span
style="margin: 0 0 20px 0; display: inline-block; vertical-align: middle; width: 100%;"
>
<a
target="_blank"
href="https://pikwizard.com/video/financial-data-visualization-with-stock-and-market-trends/aea843bc902d07d4566747ab79de70a8/"
style="text-decoration: none; font-size: 10px; margin: 0;"
>
<video controls style="width: 100%; margin: 0;">
<source src="https://player.vimeo.com/progressive_redirect/playback/770297635/rendition/240p/file.mp4?loc=external&oauth2_token_id=1223210874&signature=8bf364c57b5a29598ffb978da7189c620e73297a964873e65c05706edf152e22" type="video/mp4"
poster="https://pikwizard.com/pw/medium/aea843bc902d07d4566747ab79de70a8.jpg"/>
Your browser does not support the video tag.
</video>
<p style="font-size: 12px; margin: 0;">PikWizard</p>
</a>
</span>
</span>
Free (free of charge)
Free for personal and commercial use.
Author: Awesome Content