
- Home >
- Stock Videos >
- Financial Graph Animation in Industrial Environment
Financial Graph Animation in Industrial Environment Video
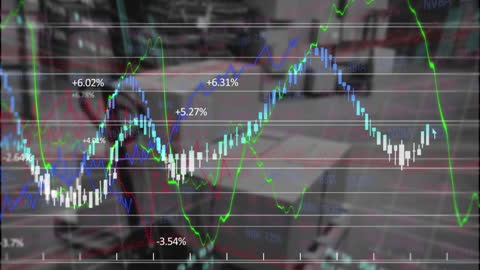
This visual displays financial graphs with fluctuating stats, overlaid on an industrial warehouse background. Useful for illustrating financial data analytics, investment growth, and economics courses. Great in business presentations to showcase market trends in a dynamic setting.
Powered by 


2
downloads
downloads
Tags:
More
Credit Photo
If you would like to credit the Photo, here are some ways you can do so
Text Link
video Link
<span class="text-link">
<span>
<a target="_blank" href=https://pikwizard.com/video/financial-graph-animation-in-industrial-environment/6f453ab1e49522fc65cc16d956680545/>PikWizard</a>
</span>
</span>
<span class="image-link">
<span
style="margin: 0 0 20px 0; display: inline-block; vertical-align: middle; width: 100%;"
>
<a
target="_blank"
href="https://pikwizard.com/video/financial-graph-animation-in-industrial-environment/6f453ab1e49522fc65cc16d956680545/"
style="text-decoration: none; font-size: 10px; margin: 0;"
>
<video controls style="width: 100%; margin: 0;">
<source src="https://player.vimeo.com/progressive_redirect/playback/758855484/rendition/240p/file.mp4?loc=external&oauth2_token_id=1223210874&signature=517c80f8c1d9140b0d70a62fdb679d4c48a17c631148d9e252f76527e0aa1b8e" type="video/mp4"
poster="https://pikwizard.com/pw/medium/6f453ab1e49522fc65cc16d956680545.jpg"/>
Your browser does not support the video tag.
</video>
<p style="font-size: 12px; margin: 0;">PikWizard</p>
</a>
</span>
</span>
Free (free of charge)
Free for personal and commercial use.
Author: Awesome Content