
- Home >
- Stock Videos >
- Financial Market Stock Analysis with Downtrend Projection
Financial Market Stock Analysis with Downtrend Projection Video
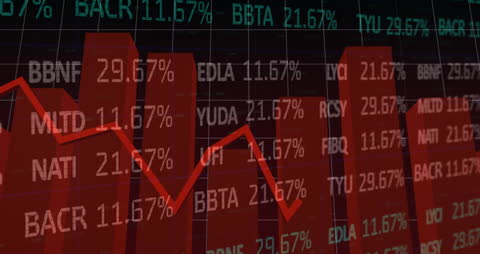
This visual represents fluctuating financial market data with a strong downtrend indicated by decreasing stock figures and prominent red graph indicators. The visualization suggests implications for investments and economic stability, and is suitable for illustrating market reports, economic analysis, and insights into financial downturns.
Powered by 


1
downloads
downloads
Tags:
More
Credit Photo
If you would like to credit the Photo, here are some ways you can do so
Text Link
video Link
<span class="text-link">
<span>
<a target="_blank" href=https://pikwizard.com/video/financial-market-stock-analysis-with-downtrend-projection/0b9d76191fdd4e0925b3c43177ce92d5/>PikWizard</a>
</span>
</span>
<span class="image-link">
<span
style="margin: 0 0 20px 0; display: inline-block; vertical-align: middle; width: 100%;"
>
<a
target="_blank"
href="https://pikwizard.com/video/financial-market-stock-analysis-with-downtrend-projection/0b9d76191fdd4e0925b3c43177ce92d5/"
style="text-decoration: none; font-size: 10px; margin: 0;"
>
<video controls style="width: 100%; margin: 0;">
<source src="https://player.vimeo.com/progressive_redirect/playback/912747344/rendition/240p/file.mp4?loc=external&oauth2_token_id=1223210874&signature=af4db7673d16b7f2f8543c1e4bedfc804bde79c60aed2fcd0e62734c55418f8a" type="video/mp4"
poster="https://pikwizard.com/pw/medium/0b9d76191fdd4e0925b3c43177ce92d5.jpg"/>
Your browser does not support the video tag.
</video>
<p style="font-size: 12px; margin: 0;">PikWizard</p>
</a>
</span>
</span>
Free (free of charge)
Free for personal and commercial use.
Author: Awesome Content