
- Home >
- Stock Videos >
- Futuristic Data Graph Over Urban Skyline Backdrop
Futuristic Data Graph Over Urban Skyline Backdrop Video
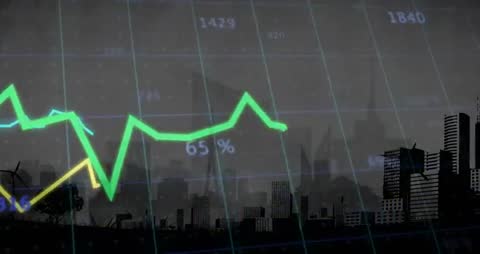
This video depicts a neon line graph with fluctuating patterns over a backdrop of city skyline silhouettes. The scene creates a sense of futuristic data analysis, combining elements of technology with urban landscape. This visual can be effectively used in presentations focusing on business analytics, technology reports, financial forecasts, data-driven decision making, or digital transformation campaigns, providing a dynamic and modern touch to the content.
Powered by 


0
downloads
downloads
Tags:
More
Credit Photo
If you would like to credit the Photo, here are some ways you can do so
Text Link
video Link
<span class="text-link">
<span>
<a target="_blank" href=https://pikwizard.com/video/futuristic-data-graph-over-urban-skyline-backdrop/3795a6ccebff46d82ac901afa35a4163/>PikWizard</a>
</span>
</span>
<span class="image-link">
<span
style="margin: 0 0 20px 0; display: inline-block; vertical-align: middle; width: 100%;"
>
<a
target="_blank"
href="https://pikwizard.com/video/futuristic-data-graph-over-urban-skyline-backdrop/3795a6ccebff46d82ac901afa35a4163/"
style="text-decoration: none; font-size: 10px; margin: 0;"
>
<video controls style="width: 100%; margin: 0;">
<source src="https://player.vimeo.com/progressive_redirect/playback/1082717684/rendition/240p/file.mp4?loc=external&oauth2_token_id=1223210874&signature=ae81ecaca7ad12a9e428290219fda4fa7dd82685c3daed8a71360b8c660df749" type="video/mp4"
poster="https://pikwizard.com/pw/medium/3795a6ccebff46d82ac901afa35a4163.jpg"/>
Your browser does not support the video tag.
</video>
<p style="font-size: 12px; margin: 0;">PikWizard</p>
</a>
</span>
</span>
Free (free of charge)
Free for personal and commercial use.
Author: Awesome Content