
- Home >
- Stock Videos >
- Global Financial Markets and Data Connection Concept
Global Financial Markets and Data Connection Concept Video
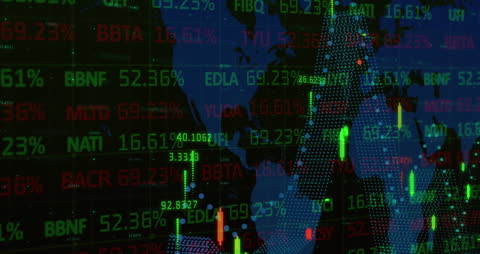
The visual representation features a data-driven animation of a map overlaid with financial numbers, symbolizing global financial markets and connections. Useful for presentations on economic trends, finance industry, stock trading behaviors, digital interfaces, and technology networks in global commerce. Can effectively illustrate concepts in reports or articles focused on interconnected global economies or digital trading platforms.
Powered by 


0
downloads
downloads
Tags:
More
Credit Photo
If you would like to credit the Photo, here are some ways you can do so
Text Link
video Link
<span class="text-link">
<span>
<a target="_blank" href=https://pikwizard.com/video/global-financial-markets-and-data-connection-concept/45f28c2109fd1e56cad2d614b8c77f81/>PikWizard</a>
</span>
</span>
<span class="image-link">
<span
style="margin: 0 0 20px 0; display: inline-block; vertical-align: middle; width: 100%;"
>
<a
target="_blank"
href="https://pikwizard.com/video/global-financial-markets-and-data-connection-concept/45f28c2109fd1e56cad2d614b8c77f81/"
style="text-decoration: none; font-size: 10px; margin: 0;"
>
<video controls style="width: 100%; margin: 0;">
<source src="https://player.vimeo.com/progressive_redirect/playback/719117797/rendition/360p/file.mp4?loc=external&oauth2_token_id=1223210874&signature=fc24792290aa8d4fcebbdd5c8482e5ac1012442ecde42c87dd51264e01f0fff8" type="video/mp4"
poster="https://pikwizard.com/pw/medium/45f28c2109fd1e56cad2d614b8c77f81.jpg"/>
Your browser does not support the video tag.
</video>
<p style="font-size: 12px; margin: 0;">PikWizard</p>
</a>
</span>
</span>
Free (free of charge)
Free for personal and commercial use.
Author: Awesome Content