
- Home >
- Stock Videos >
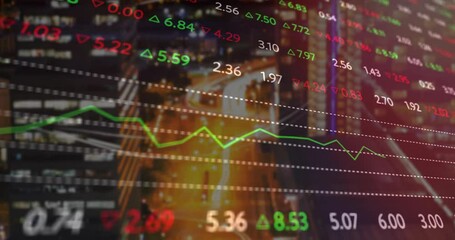
- Green Graphs Representing Market Trends and Financial Analytics
Green Graphs Representing Market Trends and Financial Analytics Video
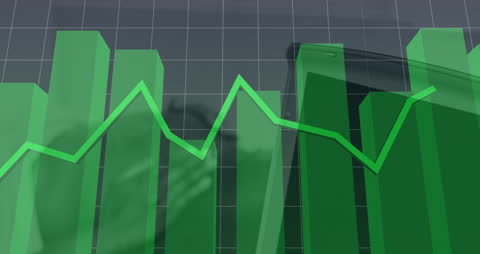
This visualization showcases green bar and line graphs, symbolizing economic and financial growth trends. It can be used in presentations about market analysis, investment strategies, economic forecasts, or financial education materials. Ideal for illustrating the concepts of data fluctuations, market performance, and analytics in a clear, impactful manner.
Powered by 


2
downloads
downloads
Tags:
More
Credit Photo
If you would like to credit the Photo, here are some ways you can do so
Text Link
video Link
<span class="text-link">
<span>
<a target="_blank" href=https://pikwizard.com/video/green-graphs-representing-market-trends-and-financial-analytics/6fb1d48d898677f7cc2a6d5d7a476e88/>PikWizard</a>
</span>
</span>
<span class="image-link">
<span
style="margin: 0 0 20px 0; display: inline-block; vertical-align: middle; width: 100%;"
>
<a
target="_blank"
href="https://pikwizard.com/video/green-graphs-representing-market-trends-and-financial-analytics/6fb1d48d898677f7cc2a6d5d7a476e88/"
style="text-decoration: none; font-size: 10px; margin: 0;"
>
<video controls style="width: 100%; margin: 0;">
<source src="https://player.vimeo.com/progressive_redirect/playback/719096358/rendition/240p/file.mp4?loc=external&oauth2_token_id=1223210874&signature=7676f8ed9931fc047317d33335f5e7c7488e3c5ce122e53f45ab8b5927d70d2f" type="video/mp4"
poster="https://pikwizard.com/pw/medium/6fb1d48d898677f7cc2a6d5d7a476e88.jpg"/>
Your browser does not support the video tag.
</video>
<p style="font-size: 12px; margin: 0;">PikWizard</p>
</a>
</span>
</span>
Free (free of charge)
Free for personal and commercial use.
Author: Awesome Content