
- Home >
- Stock Videos >
- Rising candlestick chart sweeping over Empire State Building at sunset vertical finance video
Rising candlestick chart sweeping over Empire State Building at sunset vertical finance video Video
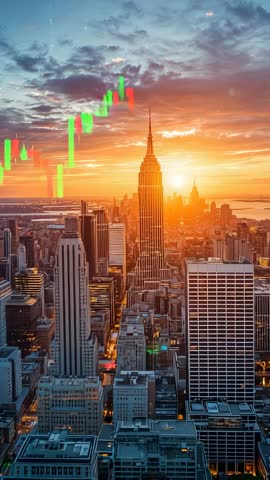
AI Generated Image. Vertical video showing candlestick chart rising across Empire State Building silhouette during vibrant sunset, blending financial data with iconic urban skyline. Warm golden light highlighting skyscrapers, creating dramatic backdrop for market growth and bullish trend storytelling. Serving financial news openers, trading platform promos, investment app intros, social media ads, corporate presentations, website hero sections. Suggestions for use: looping as mobile background, overlaying bold headlines and KPI graphics, adding soft ambient music or upbeat electronic track for dynamic energy, cropping for Instagram Reels and TikTok. Color grading options: enhancing warm tones for inspirational mood or cooling tones for sleek fintech branding.
Powered by  - Get 15% off with code: PIKWIZARD15


0
downloads
downloads
Tags:
More
Credit Photo
If you would like to credit the Photo, here are some ways you can do so
Text Link
video Link
<span class="text-link">
<span>
<a target="_blank" href=https://pikwizard.com/video/rising-candlestick-chart-sweeping-over-empire-state-building-at-sunset-vertical-finance-video/bbc489a2f776beb9ef2c9edb5f60d875/>PikWizard</a>
</span>
</span>
<span class="image-link">
<span
style="margin: 0 0 20px 0; display: inline-block; vertical-align: middle; width: 100%;"
>
<a
target="_blank"
href="https://pikwizard.com/video/rising-candlestick-chart-sweeping-over-empire-state-building-at-sunset-vertical-finance-video/bbc489a2f776beb9ef2c9edb5f60d875/"
style="text-decoration: none; font-size: 10px; margin: 0;"
>
<video controls style="width: 100%; margin: 0;">
<source src="" type="video/mp4"
poster="https://pikwizard.com/pw/medium/bbc489a2f776beb9ef2c9edb5f60d875.jpg"/>
Your browser does not support the video tag.
</video>
<p style="font-size: 12px; margin: 0;">PikWizard</p>
</a>
</span>
</span>
Free (free of charge)
Free for personal and commercial use.
Author: AI Creator