
- Home >
- Stock Videos >
- Stock Market Data Display with Animated Business Metrics
Stock Market Data Display with Animated Business Metrics Video
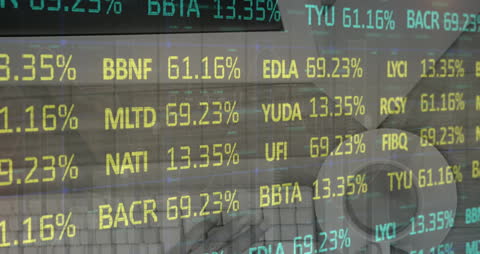
Visual representation of dynamic stock market data, showcasing fluctuations and changes in market percentages and ticker symbols. Useful for financial presentations, business analyses, investment strategies, or educational purposes on economic trends. Ideal for conveying data-driven financial insights, trading systems effects, or discussing the importance of market analyses in global business.
Powered by 


0
downloads
downloads
Tags:
More
Credit Photo
If you would like to credit the Photo, here are some ways you can do so
Text Link
video Link
<span class="text-link">
<span>
<a target="_blank" href=https://pikwizard.com/video/stock-market-data-display-with-animated-business-metrics/9583063613beb29309b8517d3b2bec4b/>PikWizard</a>
</span>
</span>
<span class="image-link">
<span
style="margin: 0 0 20px 0; display: inline-block; vertical-align: middle; width: 100%;"
>
<a
target="_blank"
href="https://pikwizard.com/video/stock-market-data-display-with-animated-business-metrics/9583063613beb29309b8517d3b2bec4b/"
style="text-decoration: none; font-size: 10px; margin: 0;"
>
<video controls style="width: 100%; margin: 0;">
<source src="https://player.vimeo.com/progressive_redirect/playback/768912054/rendition/240p/file.mp4?loc=external&oauth2_token_id=1223210874&signature=03d79d040fbc347328f4b595a3c9b9ceee5c878765e685826cf7944c1e08c5bc" type="video/mp4"
poster="https://pikwizard.com/pw/medium/9583063613beb29309b8517d3b2bec4b.jpg"/>
Your browser does not support the video tag.
</video>
<p style="font-size: 12px; margin: 0;">PikWizard</p>
</a>
</span>
</span>
Free (free of charge)
Free for personal and commercial use.
Author: Awesome Content