
- Home >
- Stock Videos >
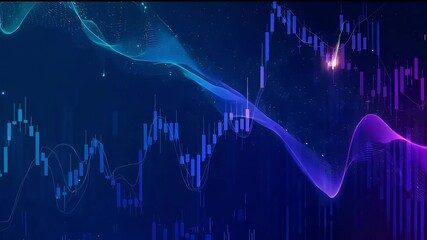
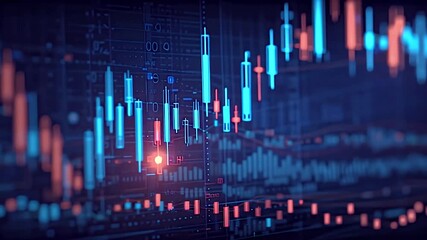
- Vertical Neon Candlestick Chart Animation Visualizing Futuristic Financial Market Data
Vertical Neon Candlestick Chart Animation Visualizing Futuristic Financial Market Data Video

AI Generated Image. Vertical loopable video showing neon pink and cyan candlestick chart moving across dark grid with horizontal guide lines and mirrored floor reflections. Animated candlesticks and glowing trend lines pulsing while digital bars and data points shifting through depth, creating futuristic market visualization. Perfect for fintech promos, trading app intros, social media ads, market analysis segments, investment presentations, broadcast opens. Optimizing for vertical 9:16 aspect ratio, loop-friendly playback, high-resolution output, motion-graphics style, RGB neon palette. Suggested uses include adding logo, overlaying headline text, inserting dynamic data labels, syncing with voiceover or soundtrack, using as background for app demo, product launch, or explainer video.
Powered by 


0
downloads
downloads
Tags:
More
Credit Photo
If you would like to credit the Photo, here are some ways you can do so
Text Link
video Link
<span class="text-link">
<span>
<a target="_blank" href=https://pikwizard.com/video/vertical-neon-candlestick-chart-animation-visualizing-futuristic-financial-market-data/0eccb49fbe8a5b0d5f849244a833624d/>PikWizard</a>
</span>
</span>
<span class="image-link">
<span
style="margin: 0 0 20px 0; display: inline-block; vertical-align: middle; width: 100%;"
>
<a
target="_blank"
href="https://pikwizard.com/video/vertical-neon-candlestick-chart-animation-visualizing-futuristic-financial-market-data/0eccb49fbe8a5b0d5f849244a833624d/"
style="text-decoration: none; font-size: 10px; margin: 0;"
>
<video controls style="width: 100%; margin: 0;">
<source src="" type="video/mp4"
poster="https://pikwizard.com/pw/medium/0eccb49fbe8a5b0d5f849244a833624d.jpg"/>
Your browser does not support the video tag.
</video>
<p style="font-size: 12px; margin: 0;">PikWizard</p>
</a>
</span>
</span>
Free (free of charge)
Free for personal and commercial use.
Author: AI Creator