

Free Analysis Stick Diagram Pictures
Discover clean Analysis Stick Diagram visuals representing data flows, strategic planning, and simplified analytics with stick-style illustrations. These royalty-free images are perfect for business presentations, educational materials, and workflow explanations—making complex concepts easy to understand.
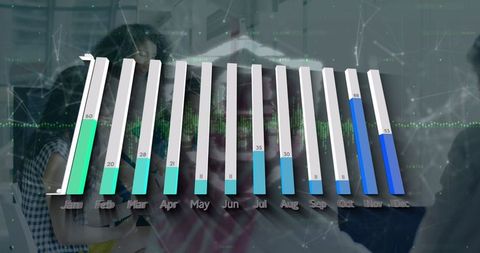
- market analysis team
- diverse data analysis
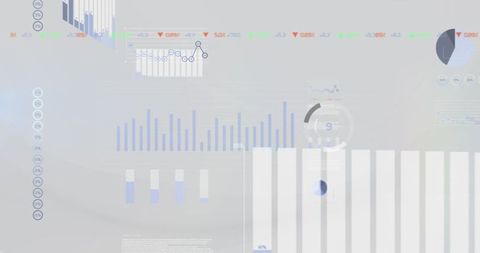
- modern financial insight
- business trend analysis
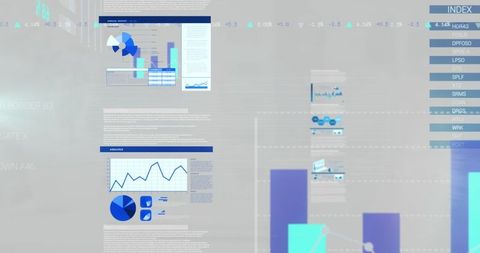
- corporate chart insights
- basketball strategy diagrams
- tech diagrams
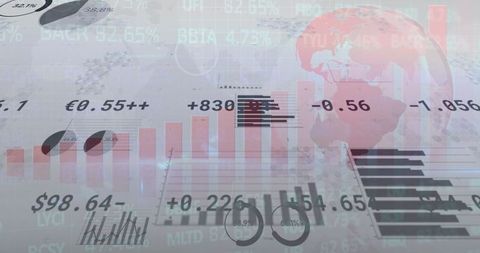
- digital finance graphs
- economic data ukraine
- finance analysis interface
- economic graphs
- visual metrics
- radar analysis
- city data analytics
- finance data team
- digital globe matrix
- fintech images
- business finance charts
- data innovation


Premium


Premium


Premium


Premium

Premium


Premium


Premium


Premium


Premium


Premium


Premium


Premium


Premium


Premium


Premium


Premium

Premium

Premium


Premium

Premium


Premium


Explore More Free Stock Images