Binary Trend Map Images Collection
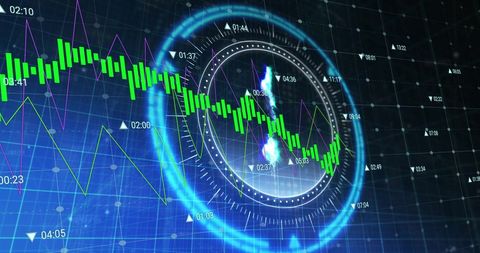
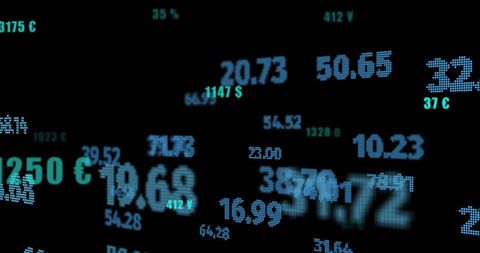
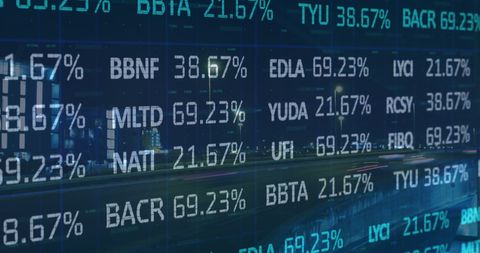
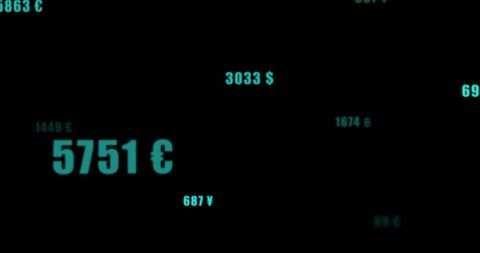
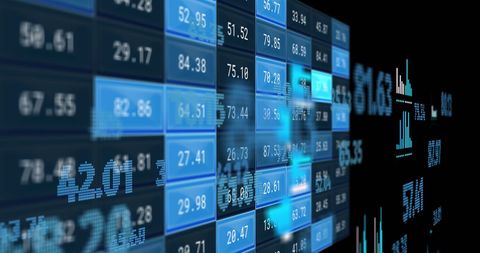
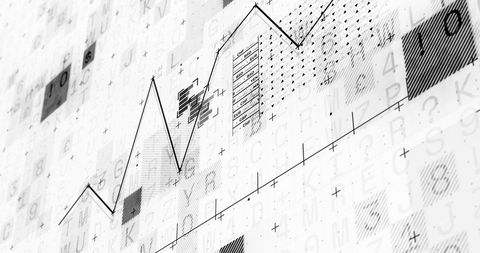
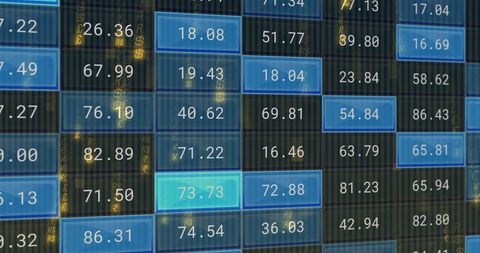
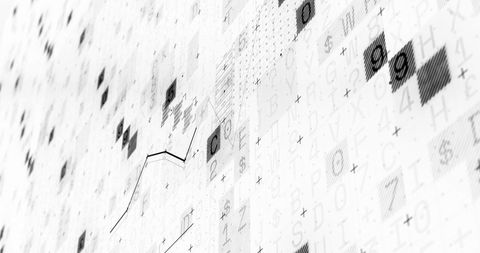
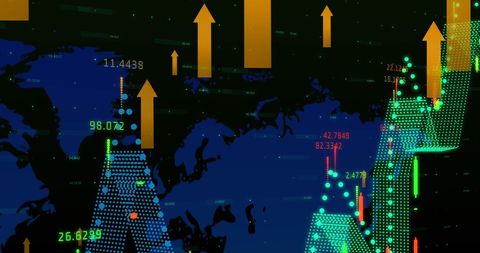
Experience the precision of the Binary Trend Map, a premium digital asset collection that elevates your visual storytelling with dynamic and creative stock assets. Benefit from a versatile collection featuring transparent photos displays and engaging digital interfaces that drive market trend insights. Enhance your projects with expertly curated visuals that seamlessly integrate data analytics aesthetics and futuristic design elements.
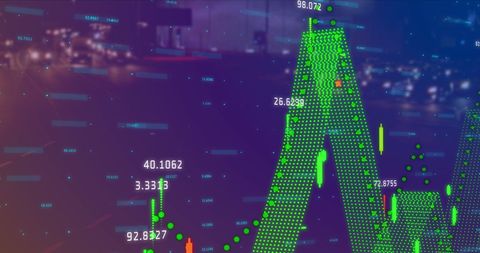
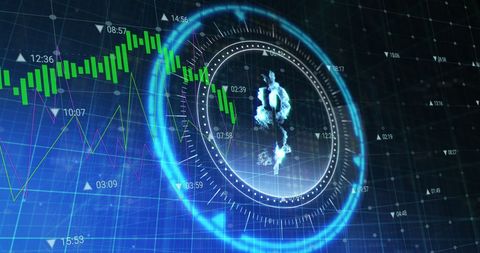
- market growth trends
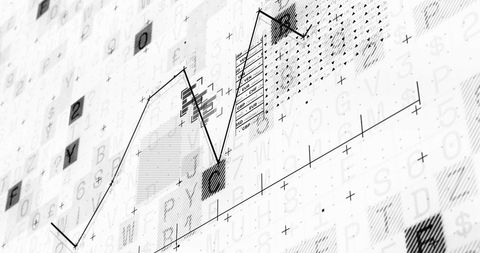
- binary code stream
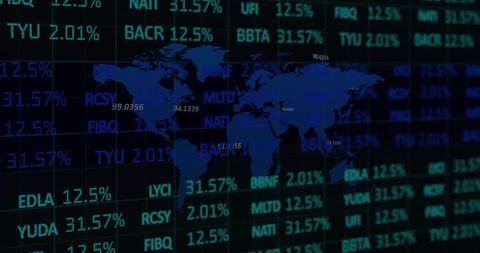
- maps
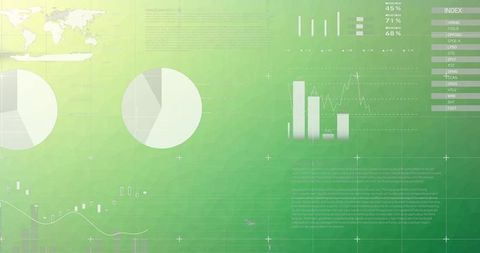
- finance world map
- binary genomic code
- economic trends
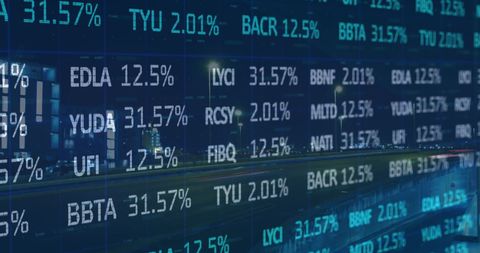
- city market trends
- urban growth trends
- market trends visuals
- covid concepts
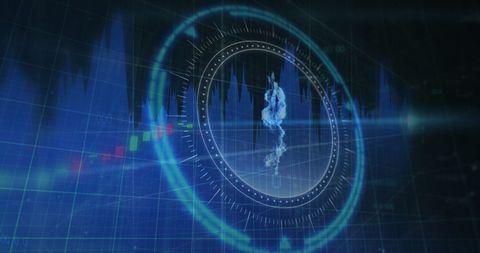
- fintech images
- digital globe matrix
- ai parrot
- business finance charts
- global communication hub
- finance data team
- digital data processing
- holiday montage
- horror zombie mummy