

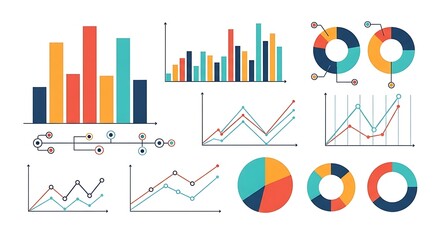
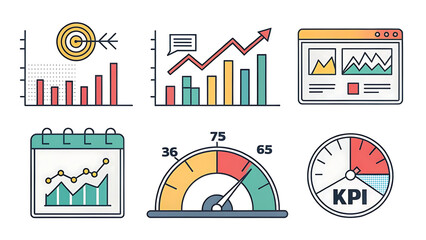
Free Business Finance Charts Images Collection
Business Finance Charts offers a premium dynamic photos collection that enhances financial presentations with vibrant, engaging visuals. The collection features high-quality, transparent photo displays that convey contemporary business trends and insightful analytics. Elevate your digital workspace with our creative portfolio, designed to bring a modern touch to financial data analysis and forward-thinking strategies.
- business finance
- finance data team
- business diversity forum
- business strategy
- global finance grid
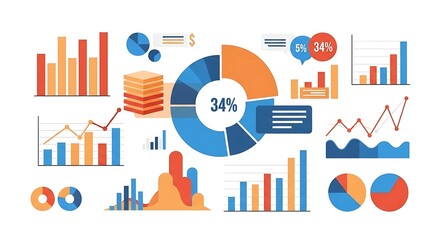
- corporate chart insights
- finance map grid
- finance meeting
- global business metrics
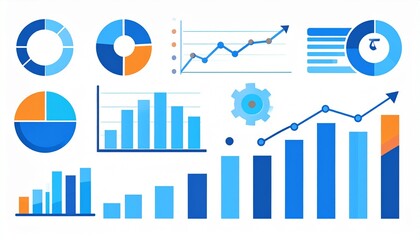
- market growth trends
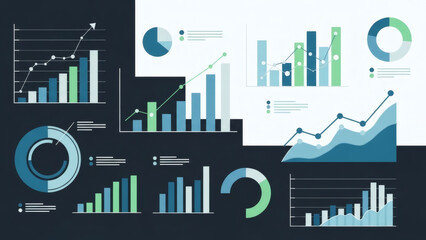
- business trend analysis
- modern business hub
- business analytics fusion
- business design
- financial chart metrics
- digital finance node
- modern business team
Premium


Premium


Premium

Premium


Premium


Premium


Premium


Premium


Premium
Premium


Premium


Premium

Premium


Premium


Premium


Premium


Premium
Premium


Premium


Premium

Premium


Premium


Premium


Premium

Premium


Explore More Free Stock Images