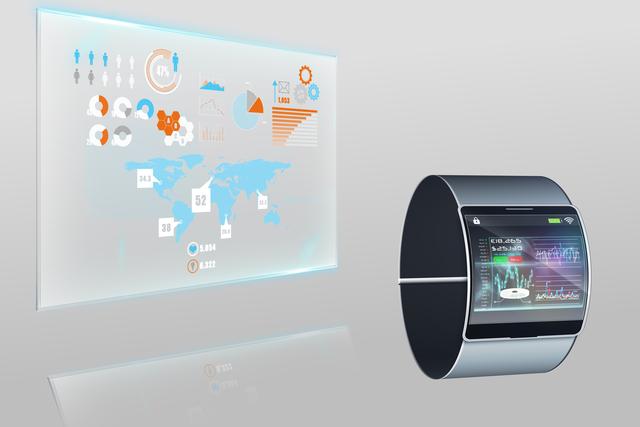
- city data analytics
- finance data team
- diverse data analysis
- data center flow
- data equations
- analytics
- big data
- business analytics fusion
- cybersecurity data encryption
- binary data flow
- data core hub
- abstract data symbols
- digital data processing
- digital data shield
- digital analytics interface
- digital data globe
- city economic data
- financial data alliance
- market data ai


