

Free Digital Finance Graphs Images Collection
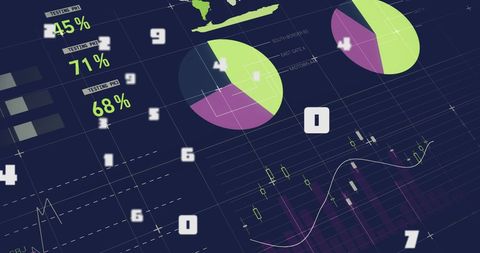
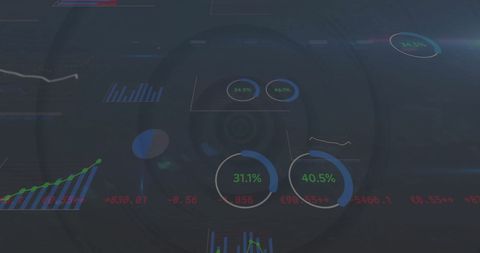
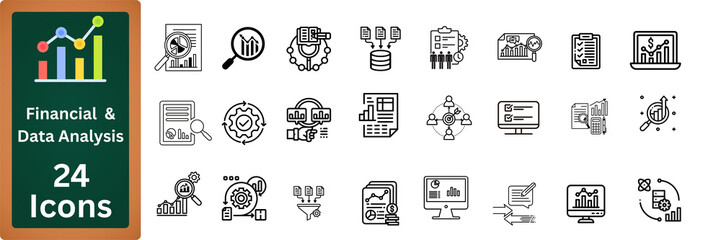
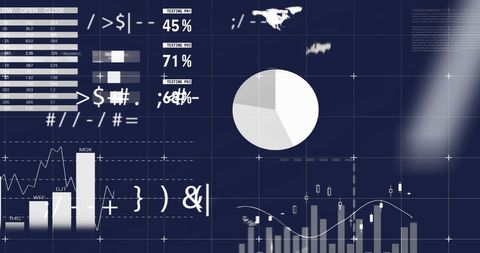
Discover our premium Digital Finance Graphs stock collection, featuring innovative financial data visualization elements and sophisticated digital interfaces designed for modern business analytics. Elevate your work with a dynamic asset collection that seamlessly integrates abstract tech visuals with interactive graphics. Experience enhanced creative potential with a vibrant photos portfolio and transparent visual displays that bring depth and clarity to your digital projects.
- digital finance node
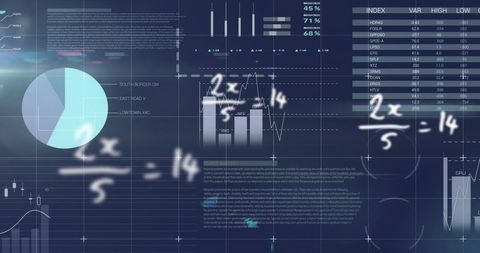
- digital market graphs
- digital globe matrix
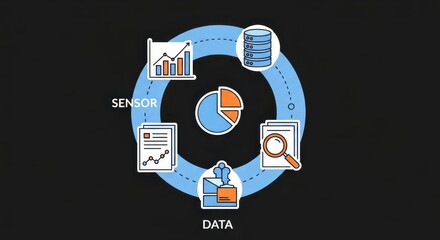
- finance data team
- graph network metrics
- global finance grid
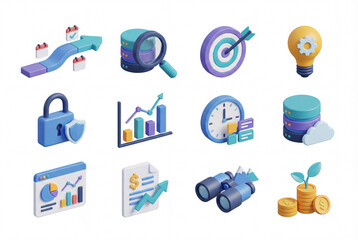
- business digital interface
- digital transformation
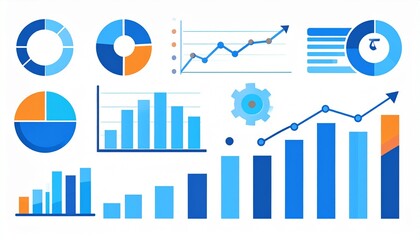
- business finance charts
- finance meeting
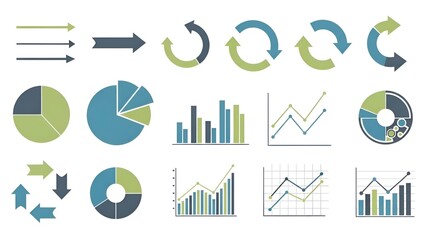
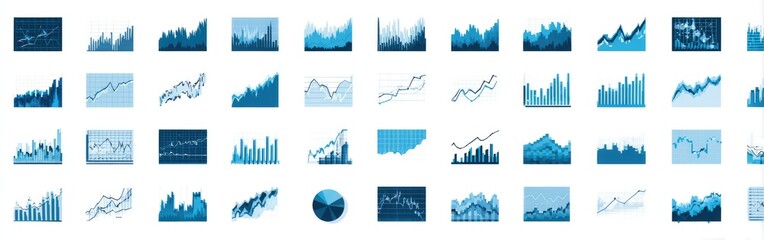
- graph images
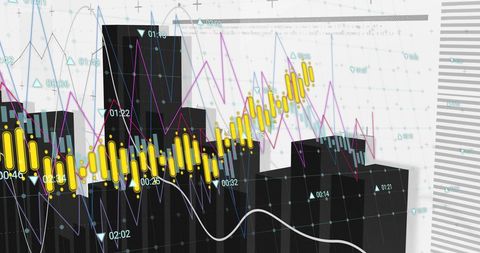
- analysis stick diagram
- digital chart insights
- digital data globe
- digital display
- digital scanner hud
- digital neon geometry
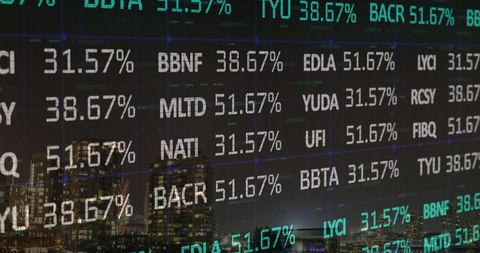
- city finance data
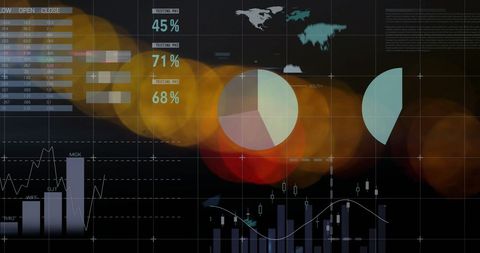
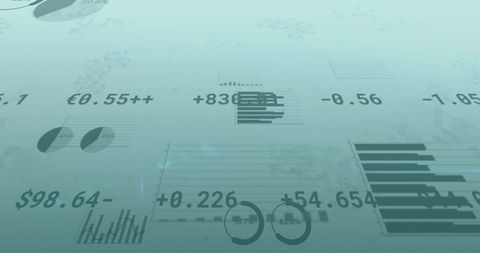
- financial graph interface


Premium

Premium


Premium


Premium


Premium


Premium


Premium

Premium


Premium


Premium


Premium

Premium


Premium

Premium


Premium


Premium


Premium


Premium

Premium


Premium


Premium


Premium


Premium


Premium


Premium


Explore More Free Stock Images