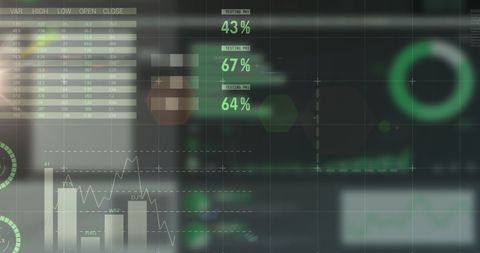
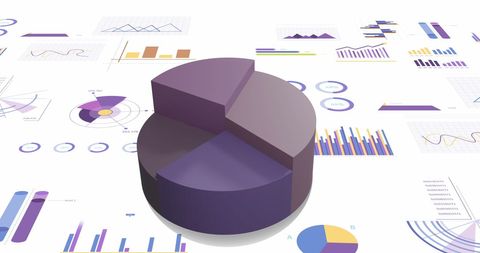
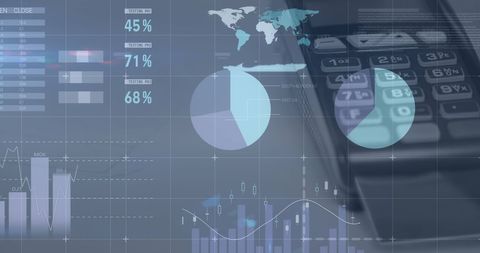
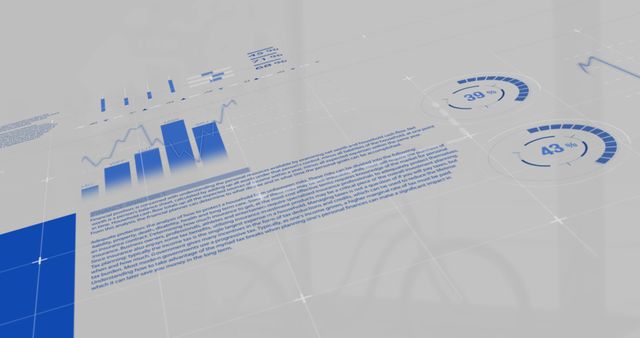
Digital Insight Array Images Collection
The Digital Insight Array offers a dynamic visual experience with a premium stock collection that enhances digital storytelling. Our innovative photos display and transparent asset types provide a versatile toolkit for modern digital trends. Experience enhanced business analytics and creative design with the Digital Insight Array for your innovative projects.
- modern digital workspace
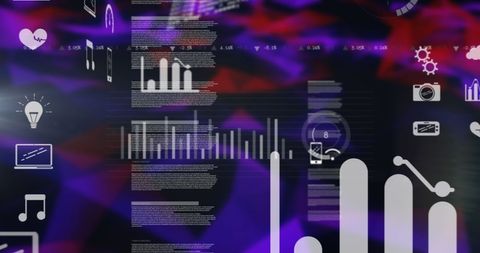
- business digital interface
- digital visual interface
- digital world data
- digital seasonal motifs
- digital neon geometry
- digital data processing
- digital data globe
- digital transformation
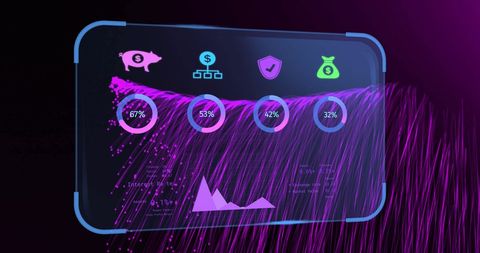
- modern financial insight
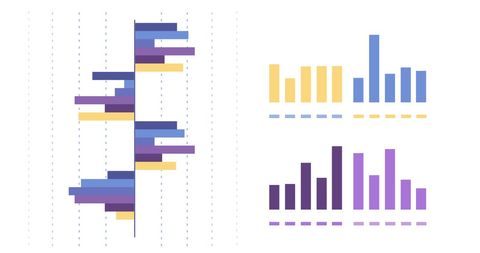
- data analysis
- santa digital art
- digital display
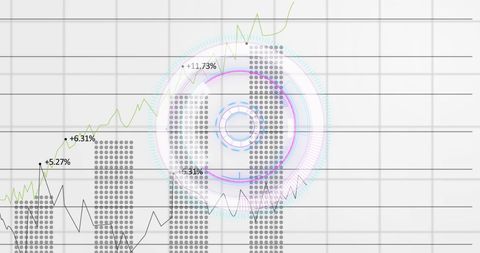
- digital economy data
- digital finance node
- digital health matrix
- digital marketing
- digital overlay interface
- digital scanner hud