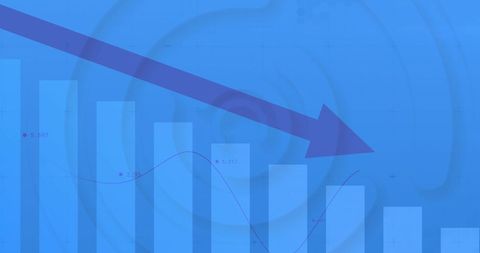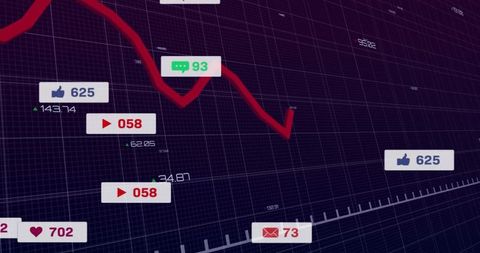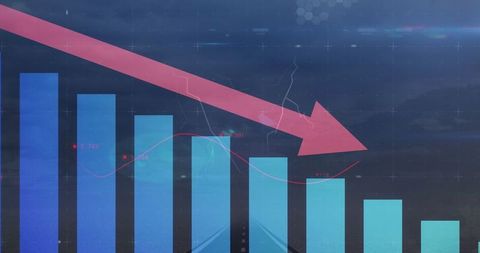
Free Downtrend Analytics Images Collection
Downtrend Analytics offers a premium stock collection with a dynamic visual display that highlights intricate financial trends. The collection features a creative blend of digital graphics and modern data visuals designed for impactful economic storytelling. Benefit from high-quality assets that seamlessly integrate vibrant digital displays and innovative artistic interpretations to elevate your projects.
- city data analytics
- business analytics fusion
- tech analytics
- digital analytics interface
- global financial analytics
- finance data team
- digital globe matrix
- graph network metrics
- market analysis team
- business finance charts
- performance data
- fintech images
- medical visualization
- digital economy data
- information technology
- indian flag with statistics
- market growth trends