A curved road sign merged with financial data graphics emphasizing synergy between financial analysis and real-world settings. Useful for topics on market progress, financial risk analysis, navigating economic challenges and strategy planning in business environments.
  1. Home > 
  2. Most Popular Photos  >  
  3. Economic Analytics

Free Economic Analytics Images Collection

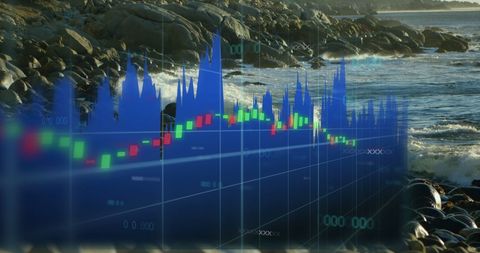
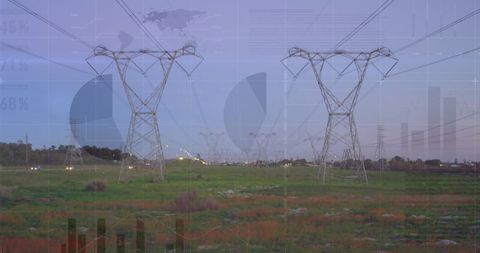
Experience Economic Analytics through our premium stock collection that combines financial data overlays and dynamic visual narratives with a sophisticated photos collection. Elevate your projects with creative asset types that blend technology, finance, and scenic landscapes to deliver compelling insights. Unlock advanced digital storytelling with Economic Analytics, designed to enhance portfolios and drive innovative visual communication.

Premium
Collection of various colorful charts and graphs, including bar charts, line graphs, and pie charts, isolated on white background
Premium
Analytical businessperson planning business growth. Business, finance and investment concept. Business strategy and planning. market research, Stock Market report, Strategy, Data Collection
Premium
A collection of thin line icons representing business finance and economic growth. Includes symbols for money, investment, profit, and data analysis charts.
Premium
Golden Wealth Strategies: Bullion Bars Symbolizing Affluence, Financial Growth, and Strategic Investment Planning
Premium
3D Business briefcase with coins and plus signs on transparent background
Premium
Collection of Icons Representing Financial Growth and Decline, Tax Documents, and Calculators for Business and Economic Concepts
Premium
close-up of a collection of business documents with various types of charts and graphs
Premium
A financial growth concept showing stacked coins increasing in height with rising percentage indicators, representing investment returns, economic progress, savings growth, and successful financial
Premium
Broker showing trading economic analytics figures on big screen in workspace to customers. Market index listings values going up and down on large monitor, price volatility concept
Premium
Coins stacked on a table with a stock market graph in the background, representing investment growth, financial analysis, and economic trends in trading.
Premium
Collection of blue business analytics and data visualization icons including bar charts, line graphs, pie charts, and a laptop screen, isolated on transparent background
Premium
collection of business analytics charts and graphs, including bar graphs, line charts, and pie charts
Premium
Female hands working on a laptop with a statistics papers
Premium
A collection of 15 stylized outline icons depicting various economic indicators profit charts and revenue growth metrics in a
Premium
Advanced analytics dashboard showcasing big data technologies for financial business insights and sales performance analysis
Premium
Investment Dashboard Filled with Graphs and Piles of Coins Representing Financial Growth, Wealth, and Economic Trends in a Modern Business Setting
Explore More Free Stock Images