Concept highlights financial analytics using digitally generated visuals. Images of declining graphs layered with various application icons represent data interpretation, business trends, and investment analysis. This is ideal for use in finance reports, technology reviews, data-related precision marketing, or educational materials on market analysis tools.
  1. Home > 
  2. Most Popular Photos  >  
  3. Economic Graphs

Free Economic Graphs Images Collection

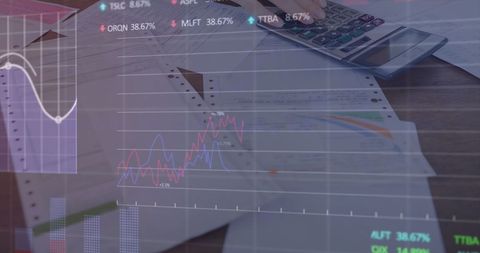
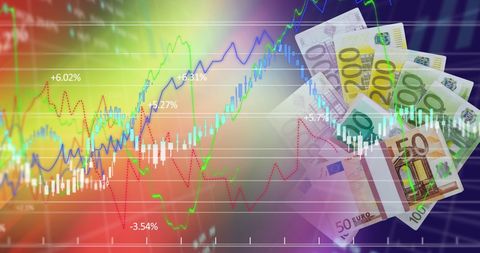
Discover the power of Economic Graphs in our premium dynamic visuals collection that unlocks key business insights. Our platform features a sophisticated transparent photos display that brings innovative financial data to life. Elevate your projects with Economic Graphs seamlessly integrated into a creative visual portfolio reflecting modern market trends.

Premium
A collection of 40 thin line icons representing economic development, including charts, graphs, and business concepts, suitable for presentations and websites
Premium
Set of coin and financial graph for economic concept
Premium
Stacks of coins represent financial growth and investment success, with rising graph symbolizing upward trends in wealth accumulation and economic progress
Premium
Businessman analyzing economic growth chart on virtual screen for business finance and financial decision making, strategy, data collection, forecasting, financial concept and business investment.
Premium
Graph showing steady growth over decades, longterm, sustained investment
Premium
Different types of graphs on white background
Premium
Business finance and investment, Analyze economic growth charts for informed business finance decisions and financial decision-making. Stock Market report, Strategy, Data Collection, Forecasting
Premium
A hand points to a growing stack of coins against a glowing financial chart
Premium
collection of business analytics charts and graphs, including bar graphs, line charts, and pie charts
Premium
Analytical businessperson planning business growth. Business, finance and investment concept. Business strategy and planning. market research, Stock Market report, Strategy, Data Collection
Premium
A collection of colorful business charts and graphs on a white background
Premium
Gráfico com seta para cima simboliza crescimento financeiro, bons resultados, avanço empresarial, metas atingidas e evolução constante em cenário econômico positivo
Premium
Collection of Icons Representing Financial Growth and Decline, Tax Documents, and Calculators for Business and Economic Concepts
Premium
Digital economy visualized with rising graphs and currency, techno-financial environment.
Explore More Free Stock Images