

Free Financial Connectivity Images Collection
Elevate your brand with our Financial Connectivity collection that features a dynamic photos collection blending modern digital data trends and innovative visual aesthetics. Experience the power of premium stock assets designed to enhance global connectivity and streamline financial narratives. Transform your projects with our creative photos display that integrates futuristic digital projections and analytical visualizations seamlessly.
- financial data alliance
- 5g connectivity
- modern financial insight
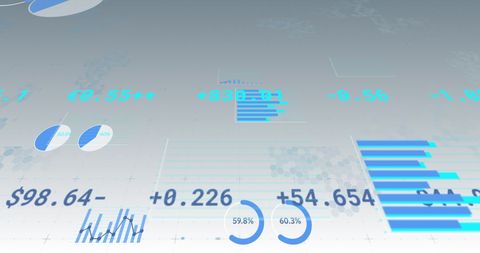
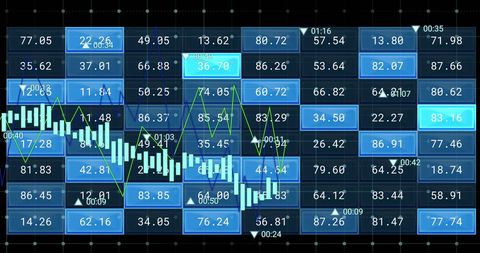
- financial graph interface
- urban financial matrix
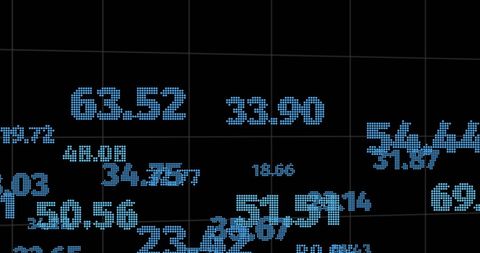
- financial chart metrics
- mobile financial data
- digital market network
- digital market vista
- financial intelligence
- fintech images
- covid concepts
- business finance charts
- global communication hub
- finance data team


Premium
Premium

Premium


Premium


Premium


Premium


Premium


Premium

Explore More Free Stock Images