Free Global Graph Images Collection
Global Graph elevates your creative portfolio with a premium dynamic photos collection that captures modern market energy. Our innovative transparent photos display fuses artistic design with urban and financial insight. Experience the superior quality and seamless integration of global financial trends and dynamic visuals in every asset.
- global data connection
- graph images
- global business metrics
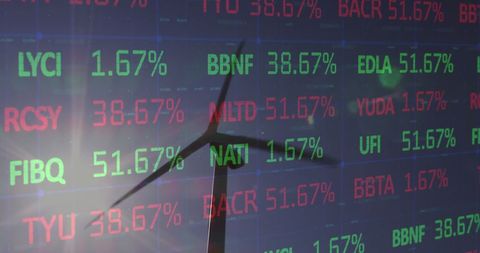
- global tech economy
- global finance grid
- ai global network
- digital finance graphs
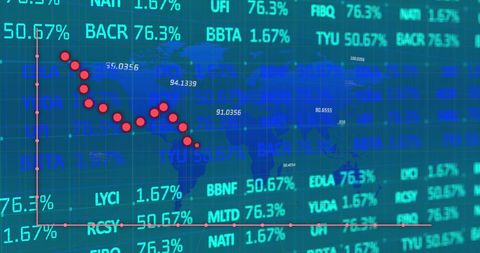
- global market charts
- bar chart on tablet screen
- graph analytics
- financial graph interface
- global communication hub
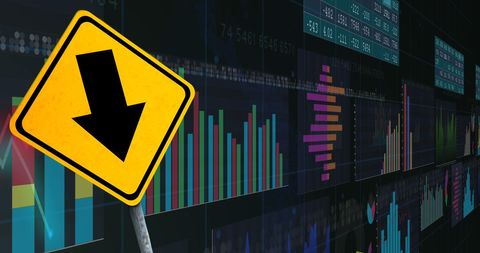
- financial crisis
- global health data
- digital global fusion
- global insight matrix
- global network technology
- global trade tech
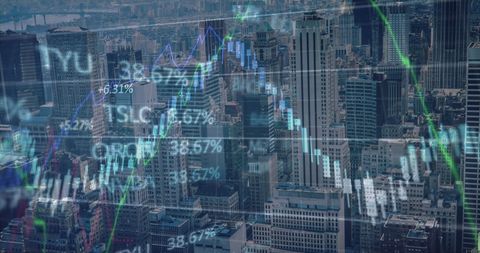
- city trend metrics