

Free Indicator Hub Images Collection
Indicator Hub offers a premium stock collection featuring dynamic digital graphics and creative visual representations that capture modern financial trends. Our curated dynamic photos collection brings together a versatile range of digital interfaces and abstract data analysis elements, emphasizing a refined blend of contemporary design and functional clarity. Experience the power of the Indicator Hub, where our transparent images and dynamic visual displays enhance any project with innovative financial and economic insights.
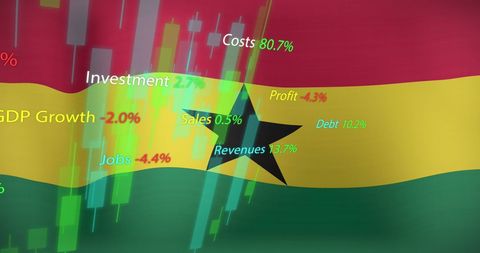
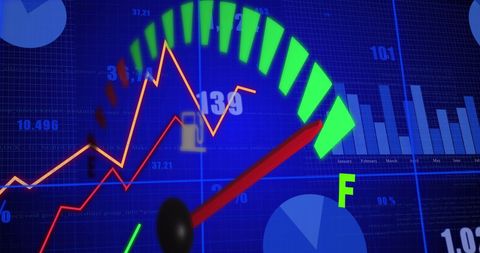
- economic indicators
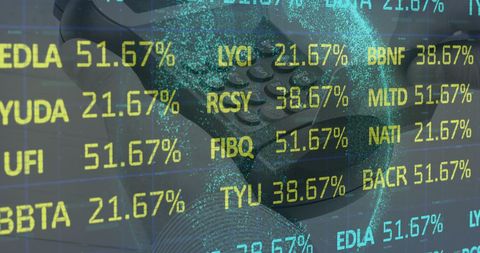
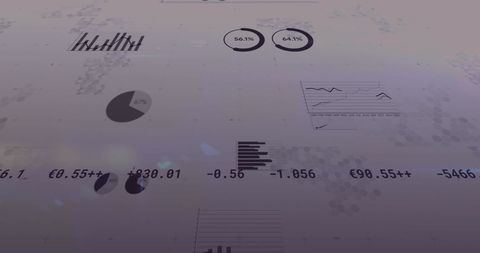
- business finance charts
- covid concepts
- finance data team
- modern digital workspace
- processing
- fintech images
- digital data processing
- santa claus silhouette
- global data connection
- information technology
- holiday montage
- stone wall background
- tech communication icons
- digital fashion design
- financial data alliance
- global business metrics
- horror zombie mummy


Premium


Premium


Explore More Free Stock Images